the dot plot shows the time trials of an experiment. each number on the dot plot represents the amount of…
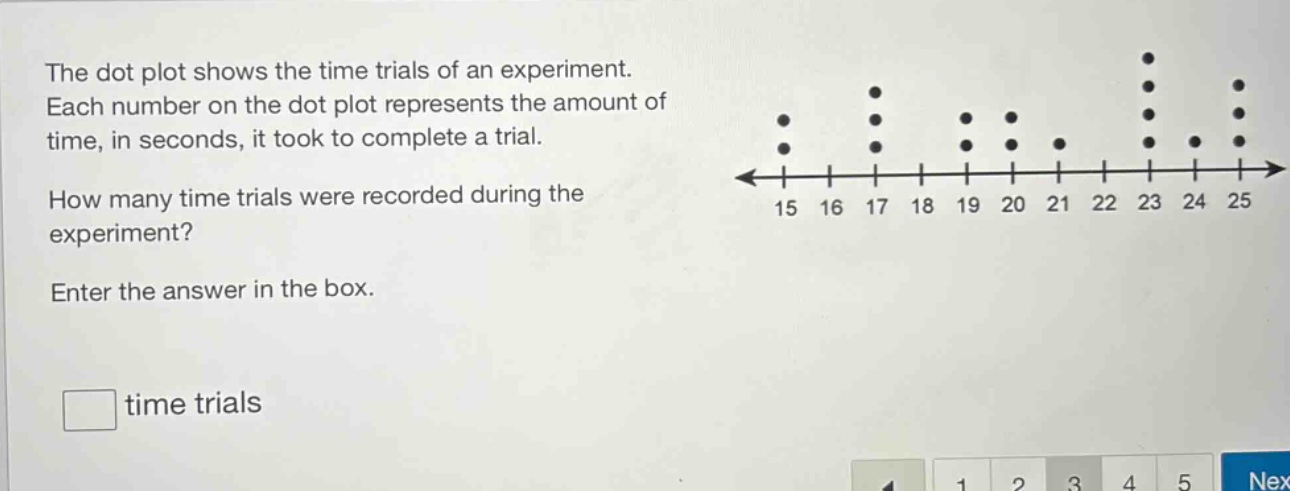
the dot plot shows the time trials of an experiment. each number on the dot plot represents the amount of time, in seconds, it took to complete a trial. how many time trials were recorded during the experiment? enter the answer in the box. time trials
Answer
Explanation:
Step1: Count dots for each value
Count the number of dots above each time - value on the dot - plot. For 15 seconds: 2 dots. For 16 seconds: 0 dots. For 17 seconds: 3 dots. For 18 seconds: 2 dots. For 19 seconds: 2 dots. For 20 seconds: 1 dot. For 21 seconds: 0 dots. For 22 seconds: 0 dots. For 23 seconds: 5 dots. For 24 seconds: 1 dot. For 25 seconds: 3 dots.
Step2: Sum up the dots
Add up the number of dots for all values. $2 + 0+3 + 2+2 + 1+0 + 0+5 + 1+3$ $=(2 + 3)+(2 + 2)+1+(5 + 1+3)$ $=5 + 4+1 + 9$ $=19$
Answer:
19