the dot plots below show the number of miles run per week for two different classes.\nclass a (mi)\nclass b…
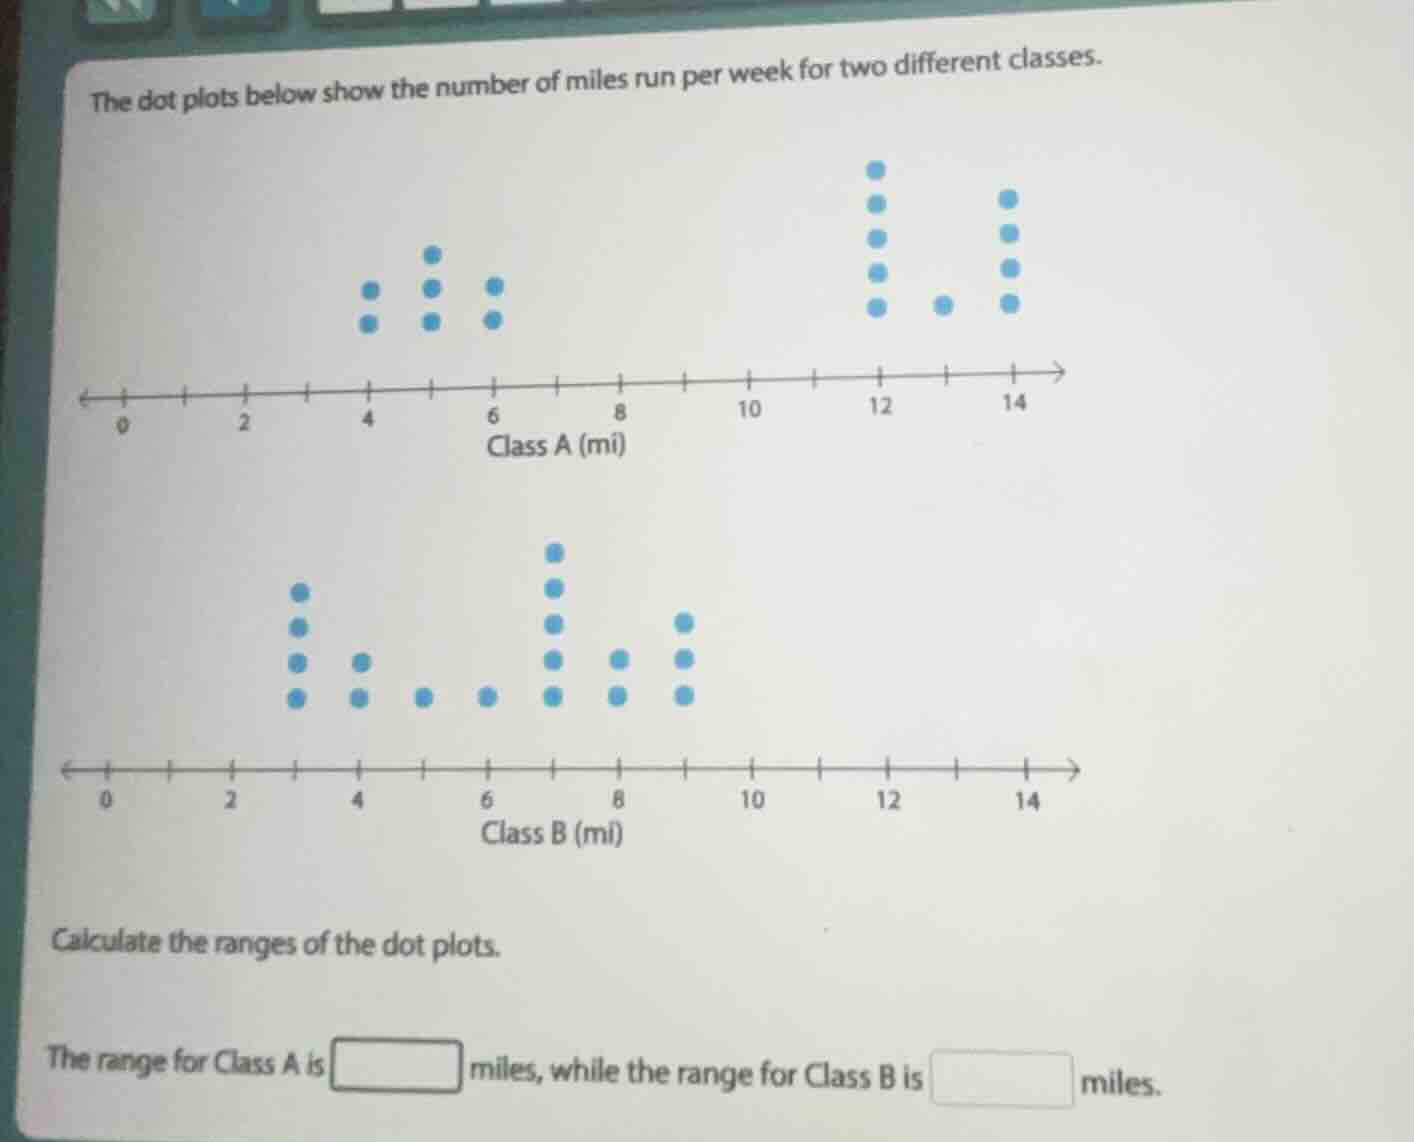
the dot plots below show the number of miles run per week for two different classes.\nclass a (mi)\nclass b (mi)\ncalculate the ranges of the dot plots.\nthe range for class a is miles, while the range for class b is miles.
Answer
Explanation:
Step1: Find Class A min/max
Min = 4, Max = 14
Step2: Calculate Class A range
$\text{Range}_A = 14 - 4 = 10$
Step3: Find Class B min/max
Min = 2, Max = 10
Step4: Calculate Class B range
$\text{Range}_B = 10 - 2 = 8$
Answer:
The range for Class A is 10 miles, while the range for Class B is 8 miles.