below are the dot plots for two data sets. (a dot plot is sometimes called a \line plot\.) data set a data…
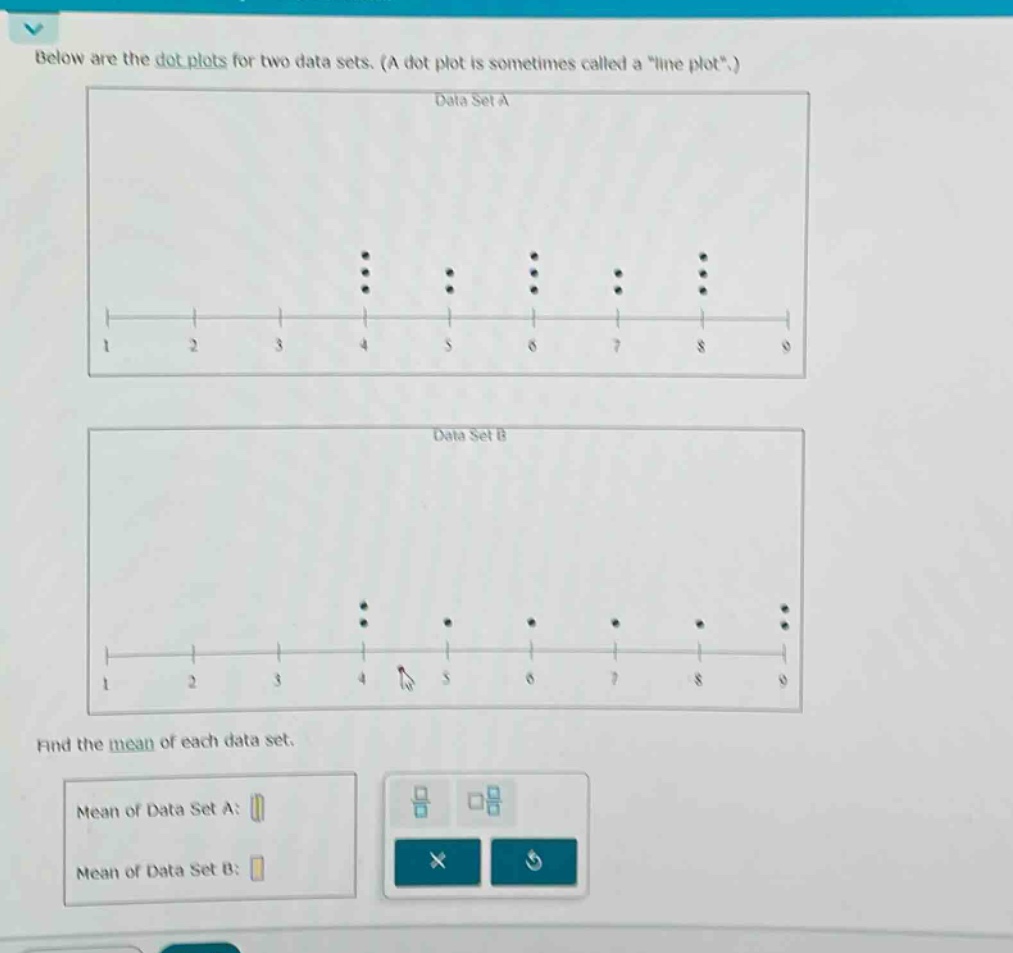
below are the dot plots for two data sets. (a dot plot is sometimes called a \line plot\.) data set a data set b find the mean of each data set. mean of data set a: mean of data set b:
Answer
Explanation:
Step1: Calculate sum for Data Set A
For Data Set A: 4 appears 3 times, 5 appears 2 times, 6 appears 3 times, 7 appears 2 times, 8 appears 3 times. Sum = (4\times3 + 5\times2+6\times3 + 7\times2+8\times3) [ \begin{align*} &=12 + 10+18+14 + 24\ &=78 \end{align*} ] Total number of data - points in Data Set A is (3 + 2+3 + 2+3=13).
Step2: Calculate mean for Data Set A
Mean of Data Set A = (\frac{78}{13}=6)
Step3: Calculate sum for Data Set B
For Data Set B: 4 appears 3 times, 5 appears 1 time, 6 appears 1 time, 7 appears 1 time, 8 appears 1 time, 9 appears 3 times. Sum = (4\times3+5\times1 + 6\times1+7\times1+8\times1+9\times3) [ \begin{align*} &=12 + 5+6+7+8+27\ &=65 \end{align*} ] Total number of data - points in Data Set B is (3 + 1+1+1+1+3 = 10).
Step4: Calculate mean for Data Set B
Mean of Data Set B=(\frac{65}{10}=6.5)
Answer:
Mean of Data Set A: 6 Mean of Data Set B: 6.5