the double box plot shows the number of daily customers at two electronics stores. which statements…
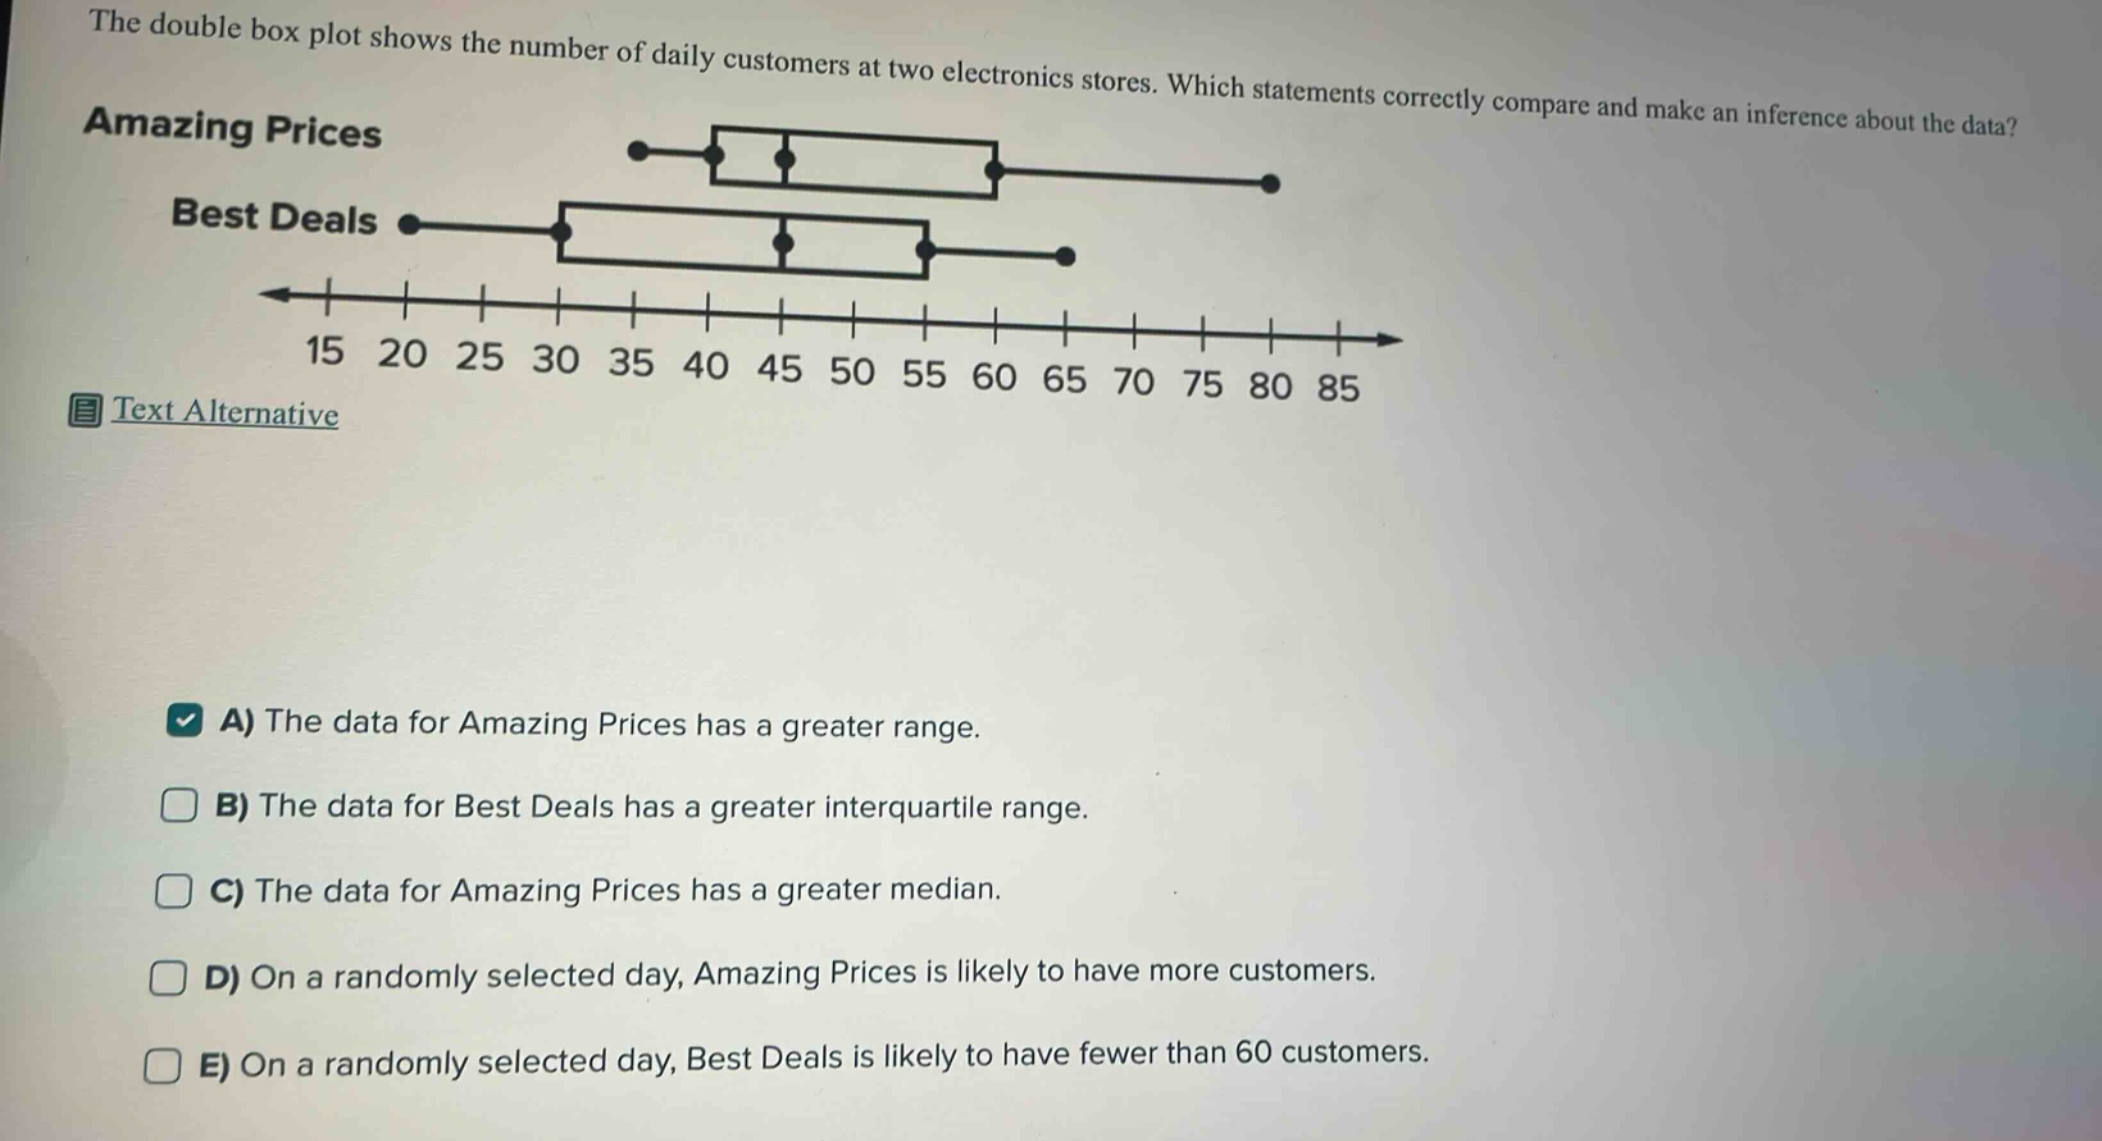
the double box plot shows the number of daily customers at two electronics stores. which statements correctly compare and make an inference about the data? amazing prices best deals 15 20 25 30 35 40 45 50 55 60 65 70 75 80 85 a) the data for amazing prices has a greater range. b) the data for best deals has a greater interquartile range. c) the data for amazing prices has a greater median. d) on a randomly selected day, amazing prices is likely to have more customers. e) on a randomly selected day, best deals is likely to have fewer than 60 customers.
Answer
Answer:
A. The data for Amazing Prices has a greater range., C. The data for Amazing Prices has a greater median., D. On a randomly selected day, Amazing Prices is likely to have more customers., E. On a randomly selected day, Best Deals is likely to have fewer than 60 customers.
Explanation:
Step1: Calculate range
Range = Max - Min. For Amazing Prices, range is larger as its max - min is greater than Best Deals'.
Step2: Check interquartile range
IQR = Q3 - Q1. Visual inspection shows Best Deals doesn't have greater IQR.
Step3: Compare medians
Median is middle value. Amazing Prices' median is higher.
Step4: Make customer - number inferences
Since Amazing Prices has higher median and range, it's likely to have more customers. And Best Deals' data mostly below 60, so likely to have fewer than 60 customers.