drag each image to the correct location on the graph. each image can be used more than once. for 10…
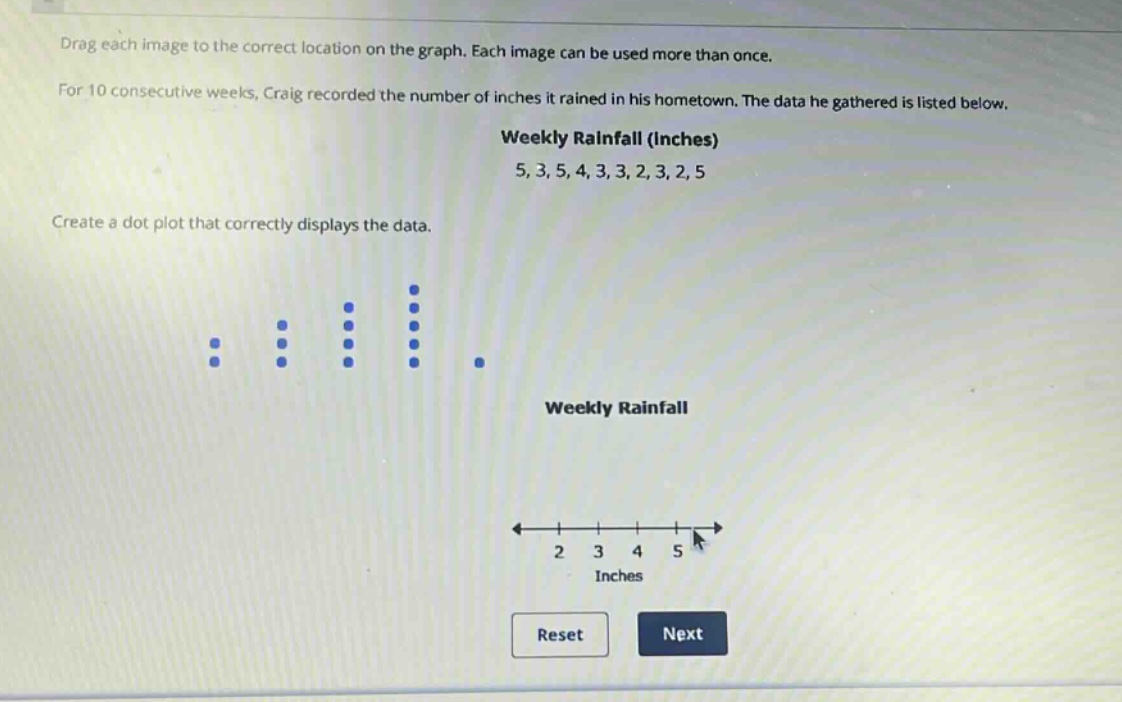
drag each image to the correct location on the graph. each image can be used more than once. for 10 consecutive weeks, craig recorded the number of inches it rained in his hometown. the data he gathered is listed below. weekly rainfall (inches) 5, 3, 5, 4, 3, 3, 2, 3, 2, 5 create a dot - plot that correctly displays the data. weekly rainfall 2 3 4 5 inches reset next
Answer
Explanation:
Step1: Count occurrences
Count how many times each value appears in the data - set 5, 3, 5, 4, 3, 3, 2, 3, 2, 5. The value 2 appears 2 times, the value 3 appears 4 times, the value 4 appears 1 time and the value 5 appears 3 times.
Step2: Place dots
On the dot - plot, for the value 2 on the horizontal axis, place 2 dots. For the value 3 on the horizontal axis, place 4 dots. For the value 4 on the horizontal axis, place 1 dot. For the value 5 on the horizontal axis, place 3 dots.
Answer:
The dot - plot should have 2 dots above 2, 4 dots above 3, 1 dot above 4 and 3 dots above 5 on the horizontal axis labeled "Inches".