drag the tiles to the correct boxes to complete the pairs. match each data set with the shape of its…
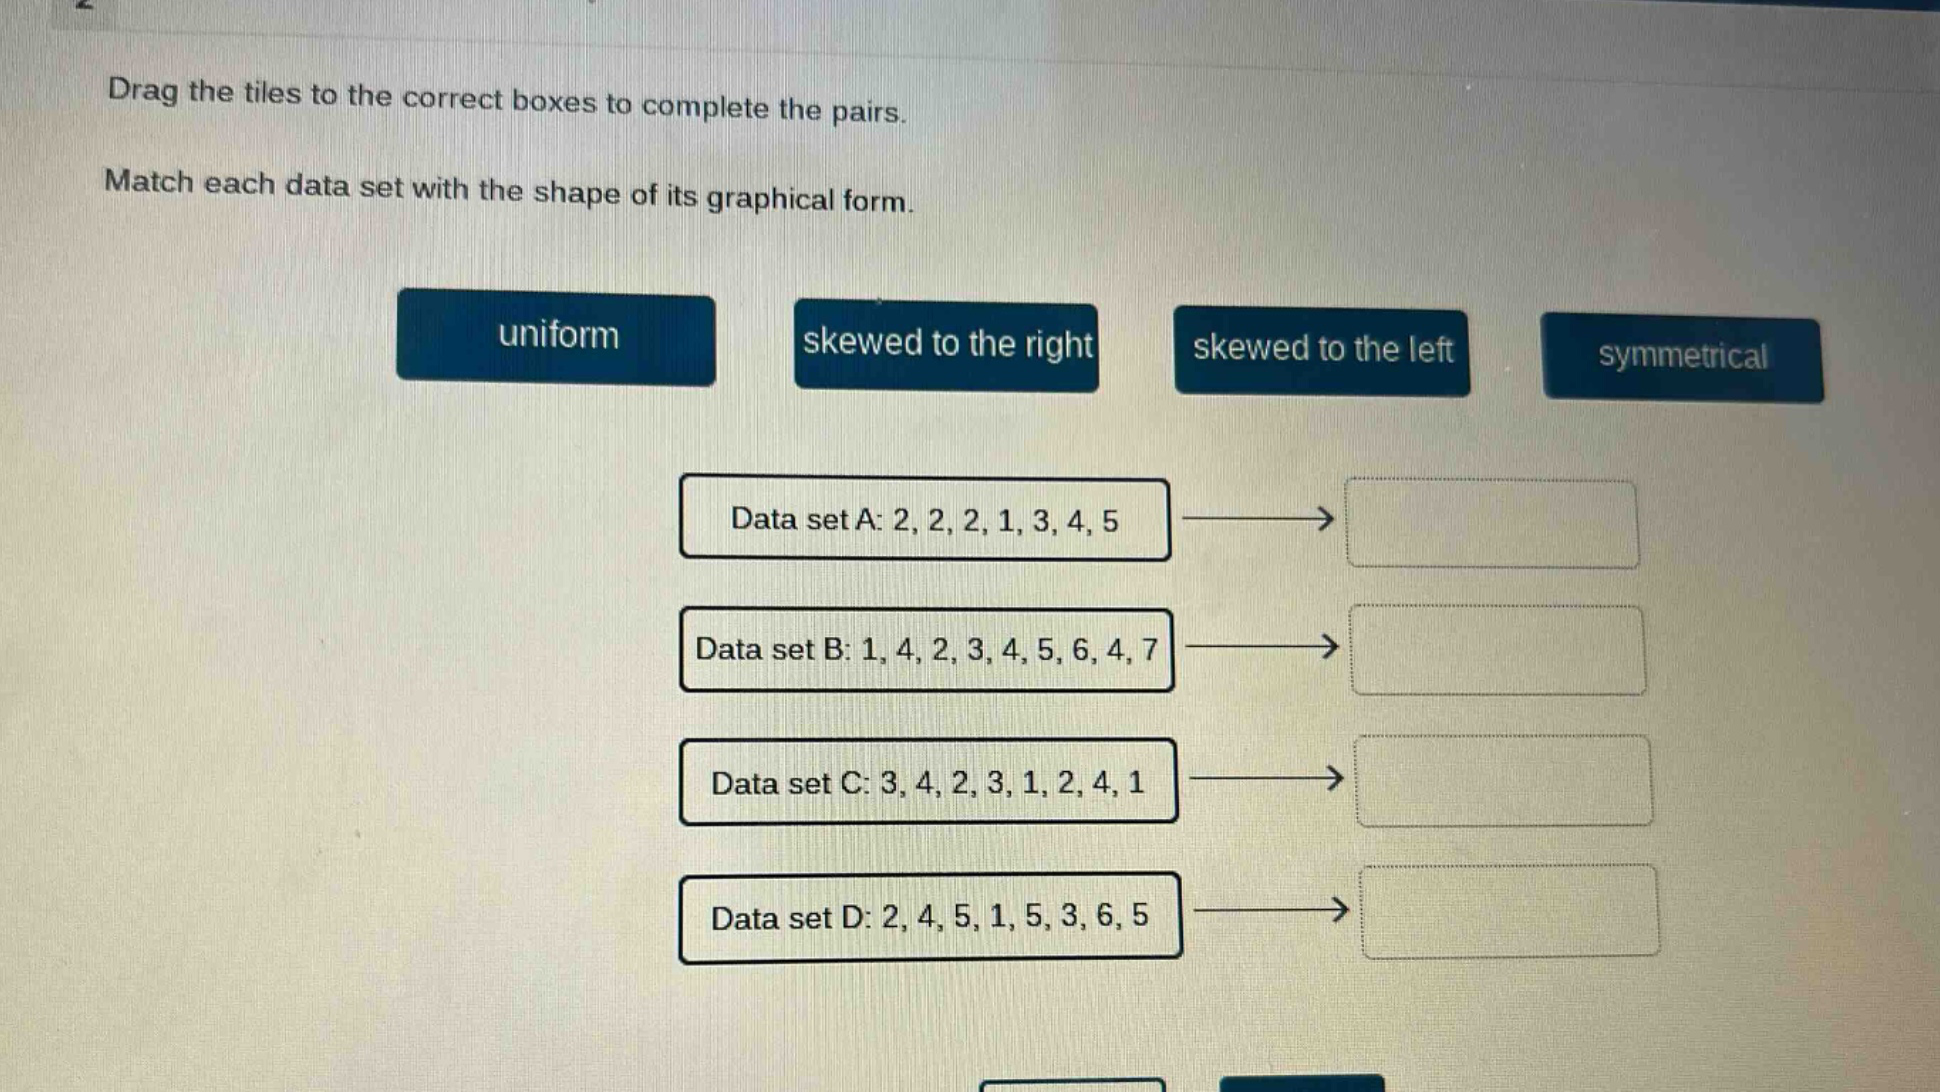
drag the tiles to the correct boxes to complete the pairs. match each data set with the shape of its graphical form. uniform skewed to the right skewed to the left symmetrical data set a: 2, 2, 2, 1, 3, 4, 5 data set b: 1, 4, 2, 3, 4, 5, 6, 4, 7 data set c: 3, 4, 2, 3, 1, 2, 4, 1 data set d: 2, 4, 5, 1, 5, 3, 6, 5
Answer
Explanation:
Step1: Analyze Data set A
Sort data set A: 1, 2, 2, 2, 3, 4, 5. There is a mode (2 appears 3 - times) and the data seems to be more concentrated on the left - hand side, so it is skewed to the right.
Step2: Analyze Data set B
Sort data set B: 1, 2, 3, 4, 4, 4, 5, 6, 7. The value 4 appears 3 times. The data is relatively evenly distributed around the middle values, so it is symmetrical.
Step3: Analyze Data set C
Sort data set C: 1, 1, 2, 2, 3, 3, 4, 4. The data is evenly spread out, so it is uniform.
Step4: Analyze Data set D
Sort data set D: 1, 2, 3, 4, 5, 5, 5, 6. There is a mode (5 appears 3 times) and the data has more values on the right - hand side, so it is skewed to the left.
Answer:
Data set A → skewed to the right Data set B → symmetrical Data set C → uniform Data set D → skewed to the left