draw a box plot for the following data. {35, 14, 29, 26, 15, 20, 26, 20, 28, 19, 23, 16, 24, 25, 37}
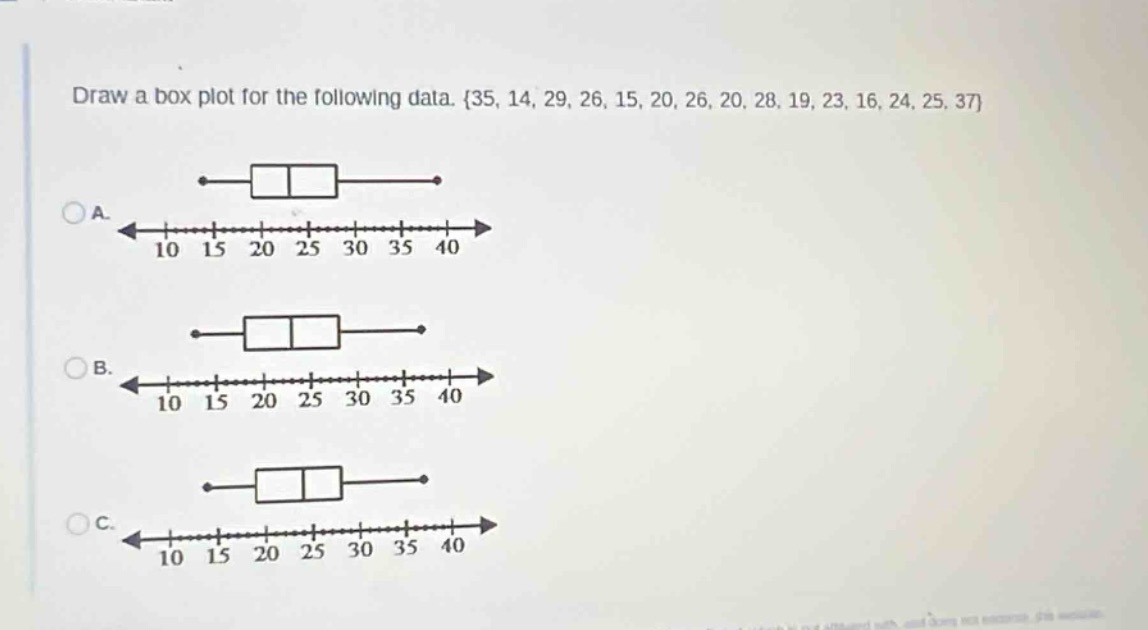
draw a box plot for the following data. {35, 14, 29, 26, 15, 20, 26, 20, 28, 19, 23, 16, 24, 25, 37}
Answer
Explanation:
Step1: Sort the data
$14, 15, 16, 19, 20, 20, 23, 24, 25, 26, 26, 28, 29, 35, 37$
Step2: Find the median (Q2)
There are 15 data - points. The median is the 8th value. So, $Q2 = 24$.
Step3: Find the lower half of the data
The lower half is $14, 15, 16, 19, 20, 20, 23$. The median of the lower half (Q1) is the 4th value, so $Q1 = 19$.
Step4: Find the upper half of the data
The upper half is $25, 26, 26, 28, 29, 35, 37$. The median of the upper half (Q3) is the 4th value of this half, so $Q3 = 28$.
Step5: Find the minimum and maximum
The minimum value is $14$ and the maximum value is $37$.
Step6: Analyze box - plot features
The box in the box - plot should start at $Q1 = 19$, end at $Q3 = 28$, and have a line at the median $Q2 = 24$. The whiskers should extend to the minimum $14$ and maximum $37$.
Answer:
(Without seeing the exact details of the options A, B, C visually, we can't directly pick one. But based on the above - calculated values, the box should have the left - hand side at 19, the right - hand side at 28, and the line inside the box at 24, with whiskers extending to 14 and 37. You need to check which option among A, B, C has these features.)