drivers pay a toll to pass over a busy bridge, and there are many toll booths that collect money. the city…
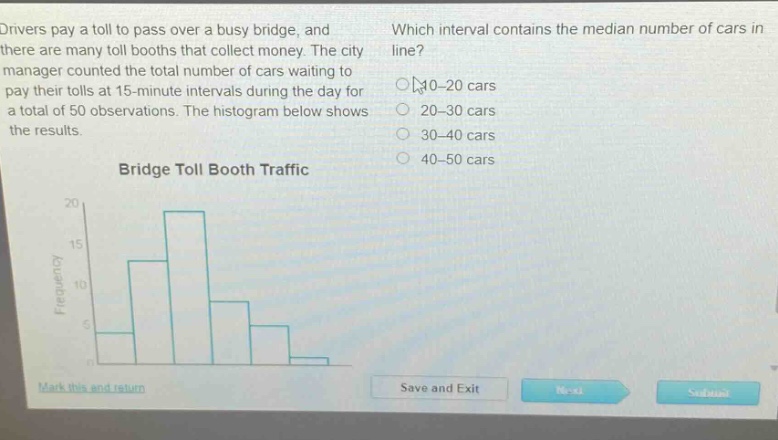
drivers pay a toll to pass over a busy bridge, and there are many toll booths that collect money. the city manager counted the total number of cars waiting to pay their tolls at 15 - minute intervals during the day for a total of 50 observations. the histogram below shows the results. bridge toll booth traffic which interval contains the median number of cars in line? 10 - 20 cars 20 - 30 cars 30 - 40 cars 40 - 50 cars
Answer
Explanation:
Step1: Find the position of the median
Since there are $n = 50$ observations, the median position is $\frac{n+1}{2}=\frac{50 + 1}{2}=25.5$. So the median is the average of the 25th and 26th - ordered data values.
Step2: Calculate cumulative frequencies
The first - class interval ($0 - 10$ cars) has a frequency of 5. The cumulative frequency up to the first interval is 5. The second - class interval ($10 - 20$ cars) has a frequency of 15. The cumulative frequency up to the second interval is $5+15 = 20$. The third - class interval ($20 - 30$ cars) has a frequency of 20. The cumulative frequency up to the third interval is $20 + 20=40$.
Step3: Determine the median interval
The 25th and 26th ordered data values fall within the $20 - 30$ cars interval because the cumulative frequency up to the $10 - 20$ cars interval is 20 (less than 25.5) and the cumulative frequency up to the $20 - 30$ cars interval is 40 (greater than 25.5).
Answer:
20–30 cars