eighteen cyclists were each asked the number of miles they biked last week. their responses are given below…
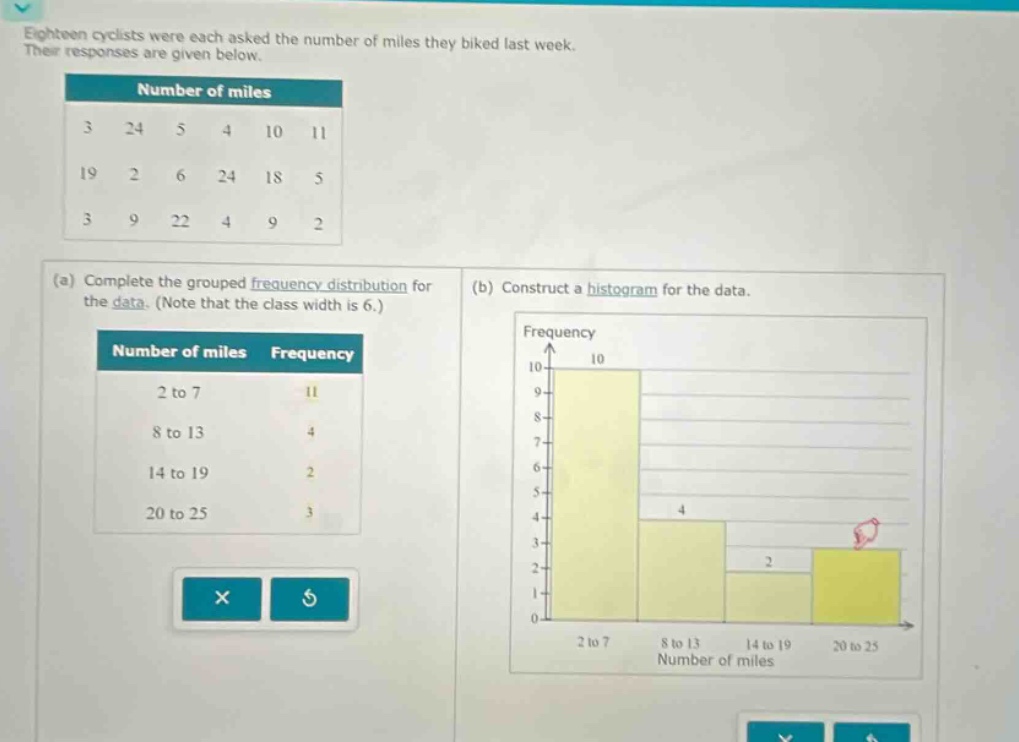
eighteen cyclists were each asked the number of miles they biked last week. their responses are given below. (a) complete the grouped frequency distribution for the data. (note that the class width is 6.) (b) construct a histogram for the data.
Answer
Explanation:
Step1: Identify task
We are given data on miles biked and need to analyze it.
Step2: Check grouped - frequency distribution
Count the number of data - points in each class interval. For 2 to 7: The values 3, 5, 4, 2, 6, 5, 3, 4, 2, 6, 5 fall in this range. Counting them gives a frequency of 11. For 8 to 13: The values 10, 11, 9, 9 fall in this range. Counting them gives a frequency of 4. For 14 to 19: The values 19, 18 fall in this range. Counting them gives a frequency of 2. For 20 to 25: The values 24, 24, 22 fall in this range. Counting them gives a frequency of 3.
Step3: Histogram construction
The x - axis represents the class intervals (2 to 7, 8 to 13, 14 to 19, 20 to 25) and the y - axis represents the frequency. The height of the bar for the interval 2 to 7 is 11, for 8 to 13 is 4, for 14 to 19 is 2 and for 20 to 25 is 3.
Answer:
The grouped - frequency distribution and histogram are already correctly completed as shown in the problem statement. The frequency distribution:
| Number of miles | Frequency |
|---|---|
| 2 to 7 | 11 |
| 8 to 13 | 4 |
| 14 to 19 | 2 |
| 20 to 25 | 3 |
| The histogram has bars with heights corresponding to the frequencies for each class interval. |