eleven students were asked how many miles they live from school. the results are shown in the dot - plot…
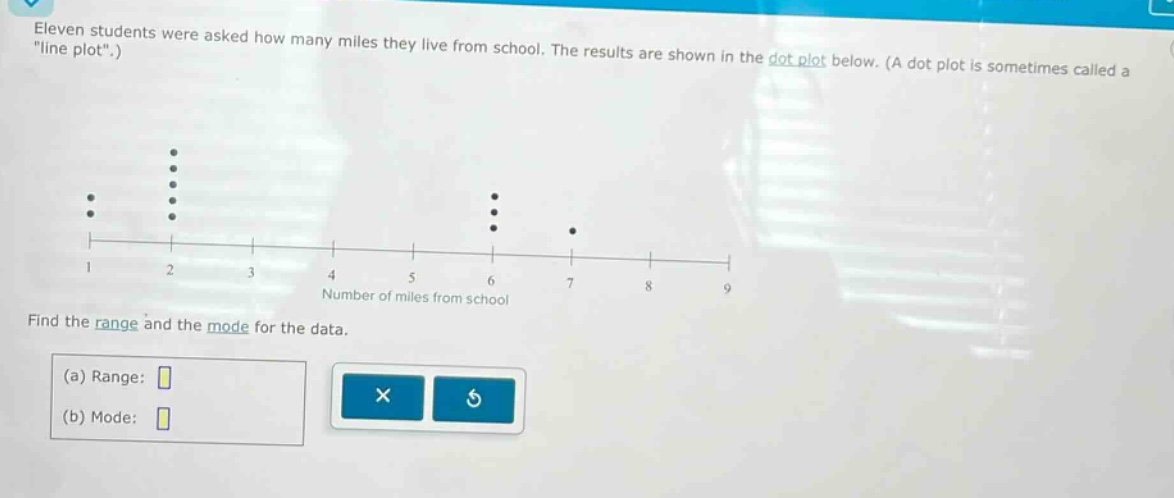
eleven students were asked how many miles they live from school. the results are shown in the dot - plot below. (a dot plot is sometimes called a \line plot\.) find the range and the mode for the data. (a) range: (b) mode:
Answer
Explanation:
Step1: Recall range formula
Range = Maximum - Minimum
Step2: Identify maximum and minimum
From the dot - plot, minimum = 1, maximum = 7 Range = 7 - 1 = 6
Step3: Recall mode definition
Mode is the most frequently occurring value.
Step4: Find the mode
The value 2 has the most dots (4 dots), so mode = 2
Answer:
(a) 6 (b) 2