eliza volunteers at a library. one day, she counts the number of books the first 20 people borrow. the list…
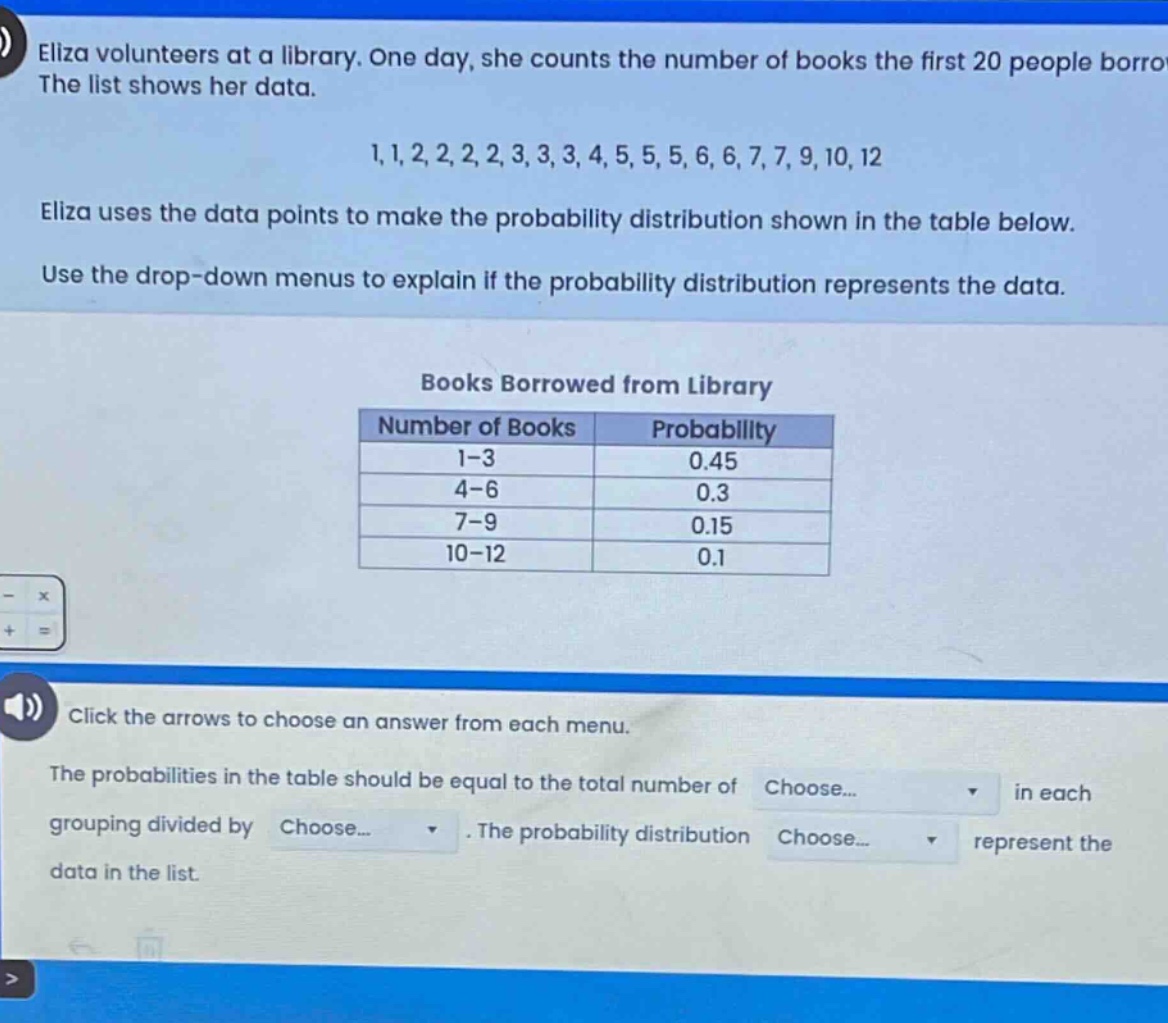
eliza volunteers at a library. one day, she counts the number of books the first 20 people borrow. the list shows her data. 1,1,2,2,2,2,3,3,3,4,5,5,5,6,6,7,7,9,10,12 eliza uses the data points to make the probability distribution shown in the table below. use the drop - down menus to explain if the probability distribution represents the data. books borrowed from library number of books probability 1 - 3 0.45 4 - 6 0.3 7 - 9 0.15 10 - 12 0.1 click the arrows to choose an answer from each menu. the probabilities in the table should be equal to the total number of choose... in each grouping divided by choose... . the probability distribution choose... represent the data in the list.
Answer
Explanation:
Step1: Definición de probabilidad experimental
La probabilidad experimental de un evento en un conjunto de datos es el número de veces que el evento ocurre dividido por el número total de observaciones.
Step2: Identificar el número total de observaciones
El número total de personas (observaciones) es $n = 20$.
Step3: Calcular las probabilidades reales para cada grupo
- Para el grupo 1 - 3: Hay $2 + 4+ 3=9$ valores. La probabilidad es $\frac{9}{20}=0.45$.
- Para el grupo 4 - 6: Hay $1 + 3+ 2 = 6$ valores. La probabilidad es $\frac{6}{20}=0.3$.
- Para el grupo 7 - 9: Hay $2+1 = 3$ valores. La probabilidad es $\frac{3}{20}=0.15$.
- Para el grupo 10 - 12: Hay $1+1 = 2$ valores. La probabilidad es $\frac{2}{20}=0.1$.
Answer:
The probabilities in the table should be equal to the total number of data - points in each grouping divided by 20. The probability distribution does represent the data in the list.