eliza volunteers at a library. one day, she counts the number of books the first 20 people borrow. the list…
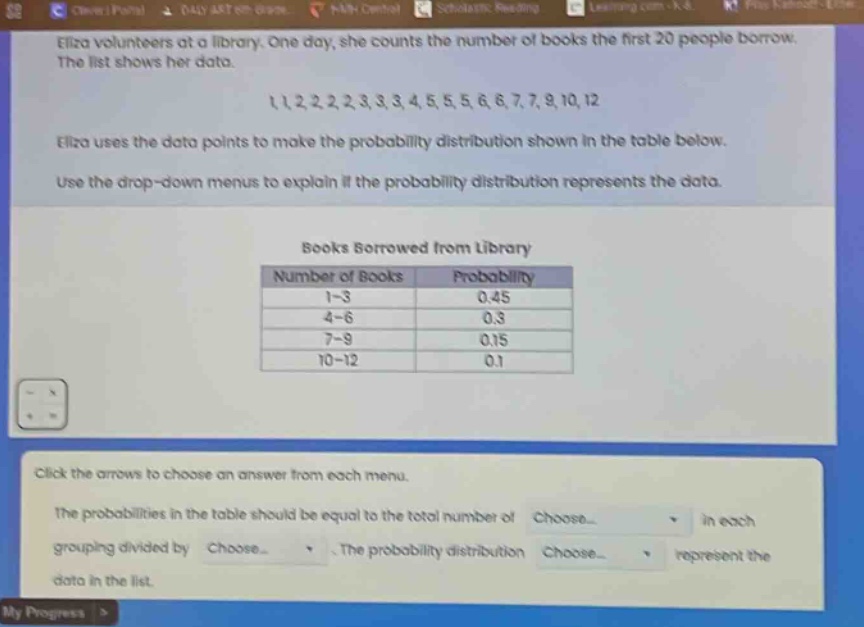
eliza volunteers at a library. one day, she counts the number of books the first 20 people borrow. the list shows her data. 1,1,2,2,2,2,3,3,3,4,5,5,5,6,6,7,7,9,10,12 eliza uses the data points to make the probability distribution shown in the table below. use the drop - down menus to explain if the probability distribution represents the data. books borrowed from library number of books probability 1 - 3 0.45 4 - 6 0.3 7 - 9 0.15 10 - 12 0.1 click the arrows to choose an answer from each menu. the probabilities in the table should be equal to the total number of choose... in each grouping divided by choose... the probability distribution choose... represent the data in the list.
Answer
Explanation:
Step1: Recall probability formula
Probability of an event = $\frac{\text{Number of favorable outcomes}}{\text{Total number of outcomes}}$
Step2: Analyze the data
There are 20 data - points (total number of people). For the group 1 - 3: count the number of values in the list 1,1,2,2,2,2,3,3 which is 9. Probability = $\frac{9}{20}=0.45$. For 4 - 6: count 3,4,5,5,5,6,6 which is 6, probability = $\frac{6}{20}=0.3$. For 7 - 9: count 7,7,9 which is 3, probability = $\frac{3}{20}=0.15$. For 10 - 12: count 10,12 which is 2, probability = $\frac{2}{20}=0.1$.
Answer:
The probabilities in the table should be equal to the total number of data - points in each grouping divided by 20. The probability distribution does represent the data in the list.