ellen works as a train conductor. on her last route, she counted the number of riders who got on at each…
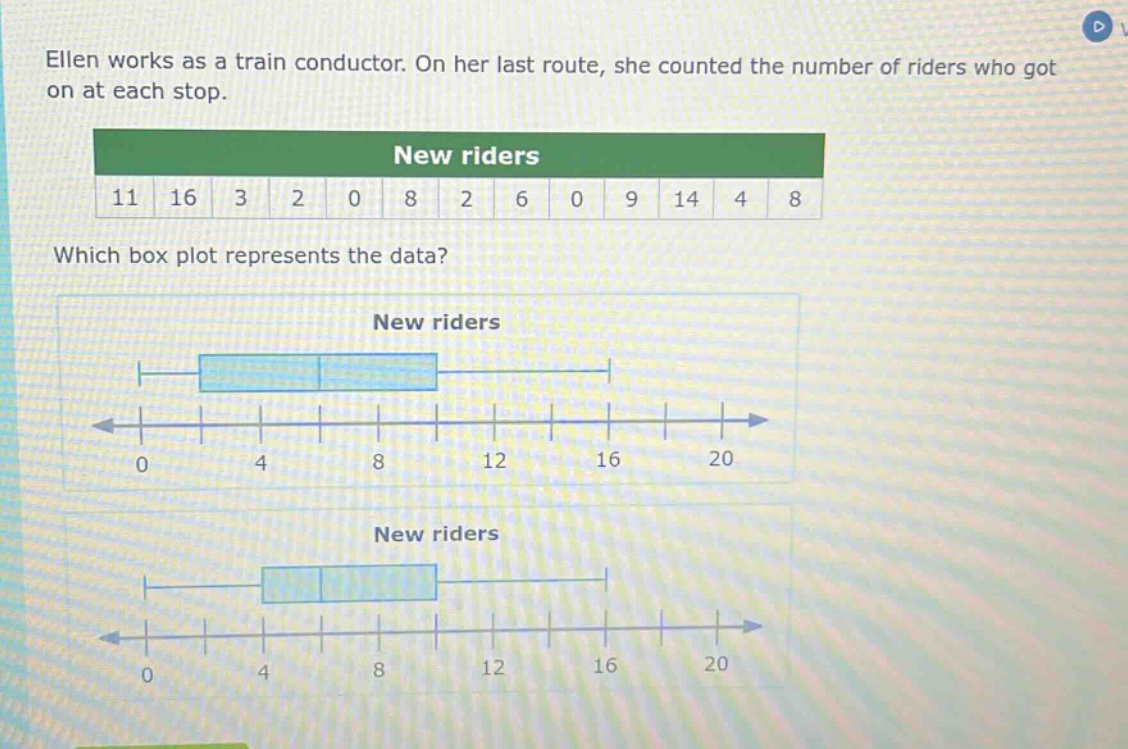
ellen works as a train conductor. on her last route, she counted the number of riders who got on at each stop. new riders 11 16 3 2 0 8 2 6 0 9 14 4 8 which box plot represents the data? new riders new riders
Answer
Answer:
To determine which box - plot represents the data, we need to find the five - number summary (minimum, first quartile $Q_1$, median, third quartile $Q_3$, maximum) of the data set ${0,0,2,2,3,4,6,8,8,9,11,14,16}$.
- Minimum value:
- The minimum value of the data set is $0$.
- First quartile ($Q_1$):
- First, find the position of $Q_1$. Since $n = 13$ (number of data points), the position of $Q_1$ is $\frac{n + 1}{4}=\frac{13+1}{4}=3.5$.
- The third value is $2$ and the fourth value is $2$. So, $Q_1=\frac{2 + 2}{2}=2$.
- Median:
- The position of the median for $n = 13$ is $\frac{n + 1}{2}=\frac{13+1}{2}=7$.
- The median is the 7th value, which is $6$.
- Third quartile ($Q_3$):
- The position of $Q_3$ is $\frac{3(n + 1)}{4}=\frac{3\times(13 + 1)}{4}=10.5$.
- The 10th value is $9$ and the 11th value is $11$. So, $Q_3=\frac{9+11}{2}=10$.
- Maximum value:
- The maximum value of the data set is $16$.
We then compare these values with the box - plots. The box - plot with a minimum around $0$, $Q_1$ around $2$, median around $6$, $Q_3$ around $10$, and maximum around $16$ is the correct one. Without seeing the full options clearly, we can't give a definite choice, but the steps to find the correct box - plot are as above.
Explanation:
Step1: Order the data
${0,0,2,2,3,4,6,8,8,9,11,14,16}$
Step2: Find the minimum
The minimum is $0$.
Step3: Calculate $Q_1$ position
$\text{Position of }Q_1=\frac{n + 1}{4}=\frac{13+1}{4}=3.5$
Step4: Determine $Q_1$
$Q_1=\frac{2 + 2}{2}=2$
Step5: Calculate median position
$\text{Position of median}=\frac{n + 1}{2}=\frac{13+1}{2}=7$
Step6: Determine median
Median $ = 6$
Step7: Calculate $Q_3$ position
$\text{Position of }Q_3=\frac{3(n + 1)}{4}=\frac{3\times(13 + 1)}{4}=10.5$
Step8: Determine $Q_3$
$Q_3=\frac{9+11}{2}=10$
Step9: Find the maximum
The maximum is $16$.