ellen works as a train conductor. on her last route, she counted the number of riders who got on at each…
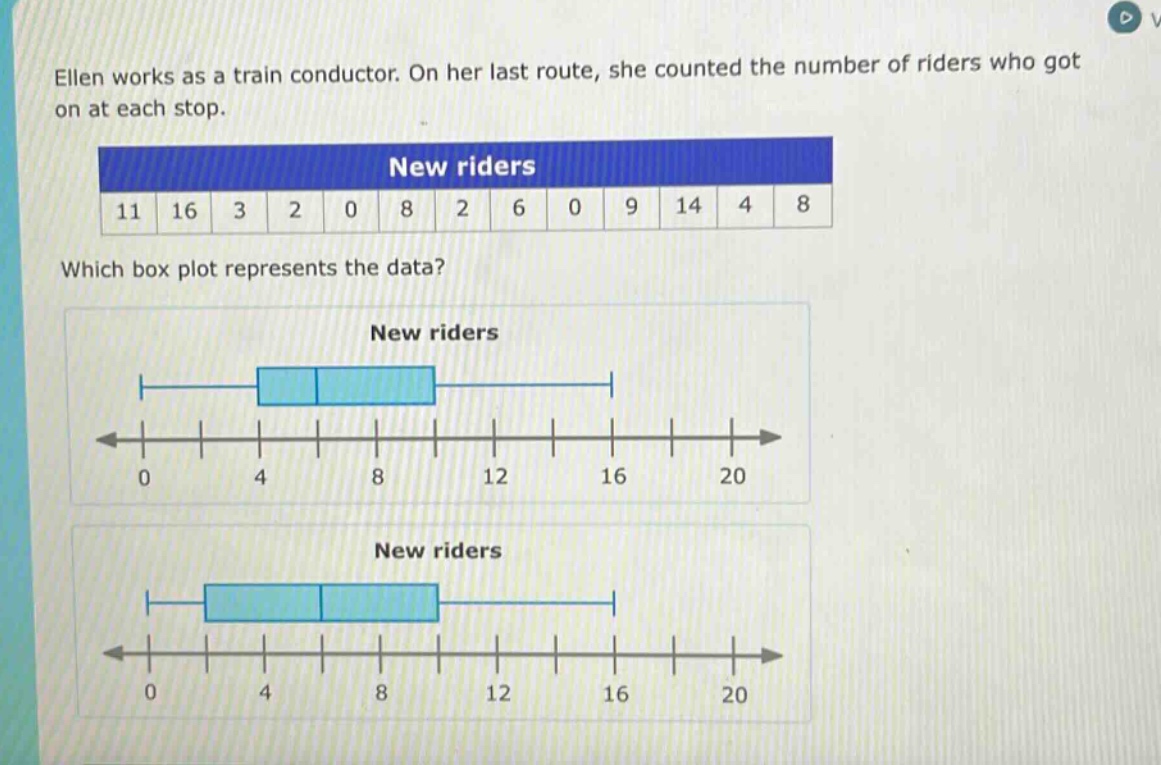
ellen works as a train conductor. on her last route, she counted the number of riders who got on at each stop.\nnew riders\n11 16 3 2 0 8 2 6 0 9 14 4 8\nwhich box plot represents the data?
Answer
Explanation:
Step1: Arrange data in ascending order
0, 0, 2, 2, 3, 4, 6, 8, 8, 9, 11, 14, 16
Step2: Find the median (Q2)
There are 13 data - points. The median is the 7th value. So, Q2 = 6.
Step3: Find the lower half of data
0, 0, 2, 2, 3, 4. The median of the lower half (Q1) is the average of the 3rd and 4th values. Q1=$\frac{2 + 2}{2}=2$.
Step4: Find the upper half of data
8, 8, 9, 11, 14, 16. The median of the upper half (Q3) is the average of the 3rd and 4th values. Q3=$\frac{9+11}{2}=10$.
Step5: Identify the minimum and maximum
The minimum value is 0 and the maximum value is 16.
The box - plot should have a box from Q1 = 2 to Q3 = 10 with a line at the median Q2 = 6, and whiskers from 0 to 16.
Answer:
The box - plot with the box starting at 2, ending at 10, a line inside the box at 6, and whiskers extending to 0 and 16. (Since no specific option identifiers are given, a description of the correct box - plot is provided).