emily has a part - time job at an ice skating rink selling hot cocoa. she decided to plot the number of hot…
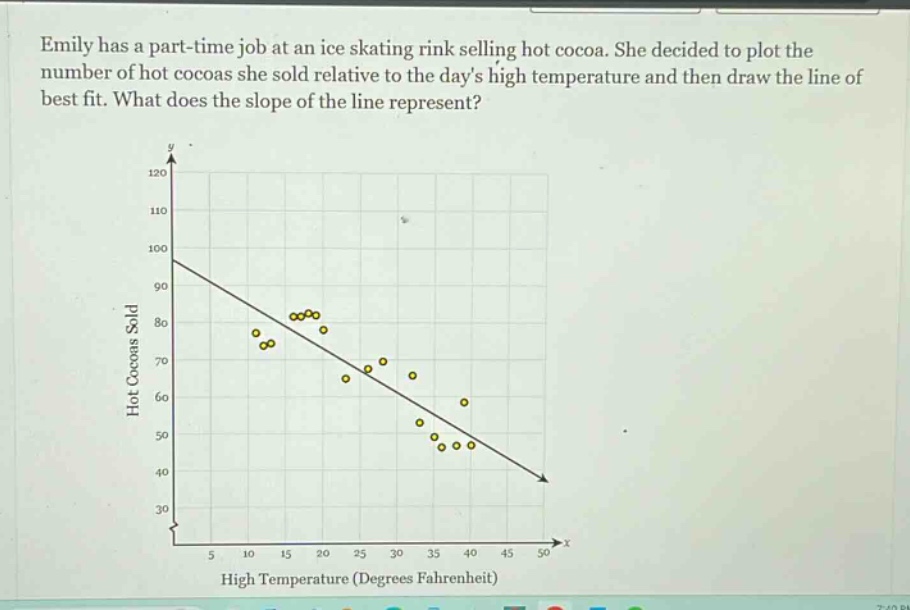
emily has a part - time job at an ice skating rink selling hot cocoa. she decided to plot the number of hot cocoas she sold relative to the days high temperature and then draw the line of best fit. what does the slope of the line represent?
Answer
Brief Explanations:
The slope of a line in a scatter - plot with two variables (here, number of hot cocoas sold and high temperature) represents the rate of change. In this context, it shows how the number of hot cocoas sold changes for a one - unit change in the high temperature. Since the line is downward - sloping, as the high temperature increases, the number of hot cocoas sold decreases. So, the slope represents the change in the number of hot cocoas sold per one - degree change in the high temperature.
Answer:
The change in the number of hot cocoas sold per one - degree change in the high temperature.