emmetts party supply store is known for their long - lasting helium balloons. emmett kept track of the…
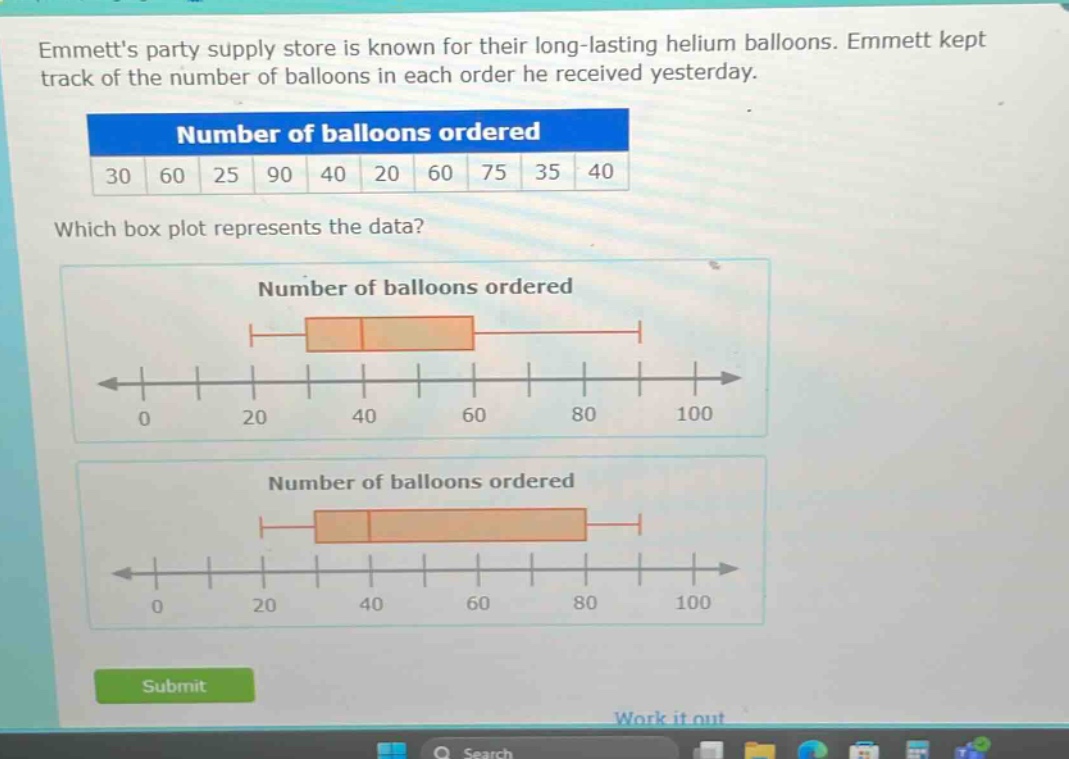
emmetts party supply store is known for their long - lasting helium balloons. emmett kept track of the number of balloons in each order he received yesterday.\nnumber of balloons ordered\n30 60 25 90 40 20 60 75 35 40\nwhich box plot represents the data?\nnumber of balloons ordered\n0 20 40 60 80 100\nnumber of balloons ordered\n0 20 40 60 80 100
Answer
Answer:
To determine the correct box - plot, we need to find the five - number summary (minimum, first quartile $Q_1$, median, third quartile $Q_3$, maximum) of the data set ${20,25,30,35,40,40,60,60,75,90}$.
- Minimum value:
- First, arrange the data in ascending order: $20,25,30,35,40,40,60,60,75,90$. The minimum value is $20$.
- Median ($Q_2$):
- Since there are $n = 10$ data points, the median is the average of the $\frac{n}{2}=5$th and $\left(\frac{n}{2}+1\right)=6$th ordered data points. So, $Q_2=\frac{40 + 40}{2}=40$.
- First quartile ($Q_1$):
- The lower half of the data is ${20,25,30,35,40}$. Since there are $n_1 = 5$ data points in the lower half, the first quartile is the $\frac{n_1 + 1}{2}=3$rd ordered data point in the lower half. So, $Q_1 = 30$.
- Third quartile ($Q_3$):
- The upper half of the data is ${60,60,75,90}$. Since there are $n_2=5$ data points in the upper half, the third quartile is the $\frac{n_2 + 1}{2}=3$rd ordered data point in the upper half. So, $Q_3 = 60$.
- Maximum value:
- The maximum value is $90$.
The box - plot should have a left - whisker starting at $20$, the left edge of the box at $30$, the line inside the box at $40$, the right edge of the box at $60$, and the right - whisker ending at $90$.
We need to visually inspect the given box - plots to find the one that matches these values.
Explanation:
Step1: Arrange data in ascending order
$20,25,30,35,40,40,60,60,75,90$
Step2: Calculate minimum
The minimum is $20$ as it is the smallest value in the ordered data.
Step3: Calculate median
$Q_2=\frac{40 + 40}{2}=40$ (average of 5th and 6th values for $n = 10$ data points)
Step4: Calculate first quartile
For lower half ${20,25,30,35,40}$, $Q_1$ is the 3rd value, so $Q_1 = 30$
Step5: Calculate third quartile
For upper half ${60,60,75,90}$, $Q_3$ is the 3rd value, so $Q_3 = 60$
Step6: Calculate maximum
The maximum is $90$ as it is the largest value in the ordered data. Then match with box - plots.