emmy is the manager at sagebrush horse rescue. to help plan the weekly schedules, she keeps track of how…
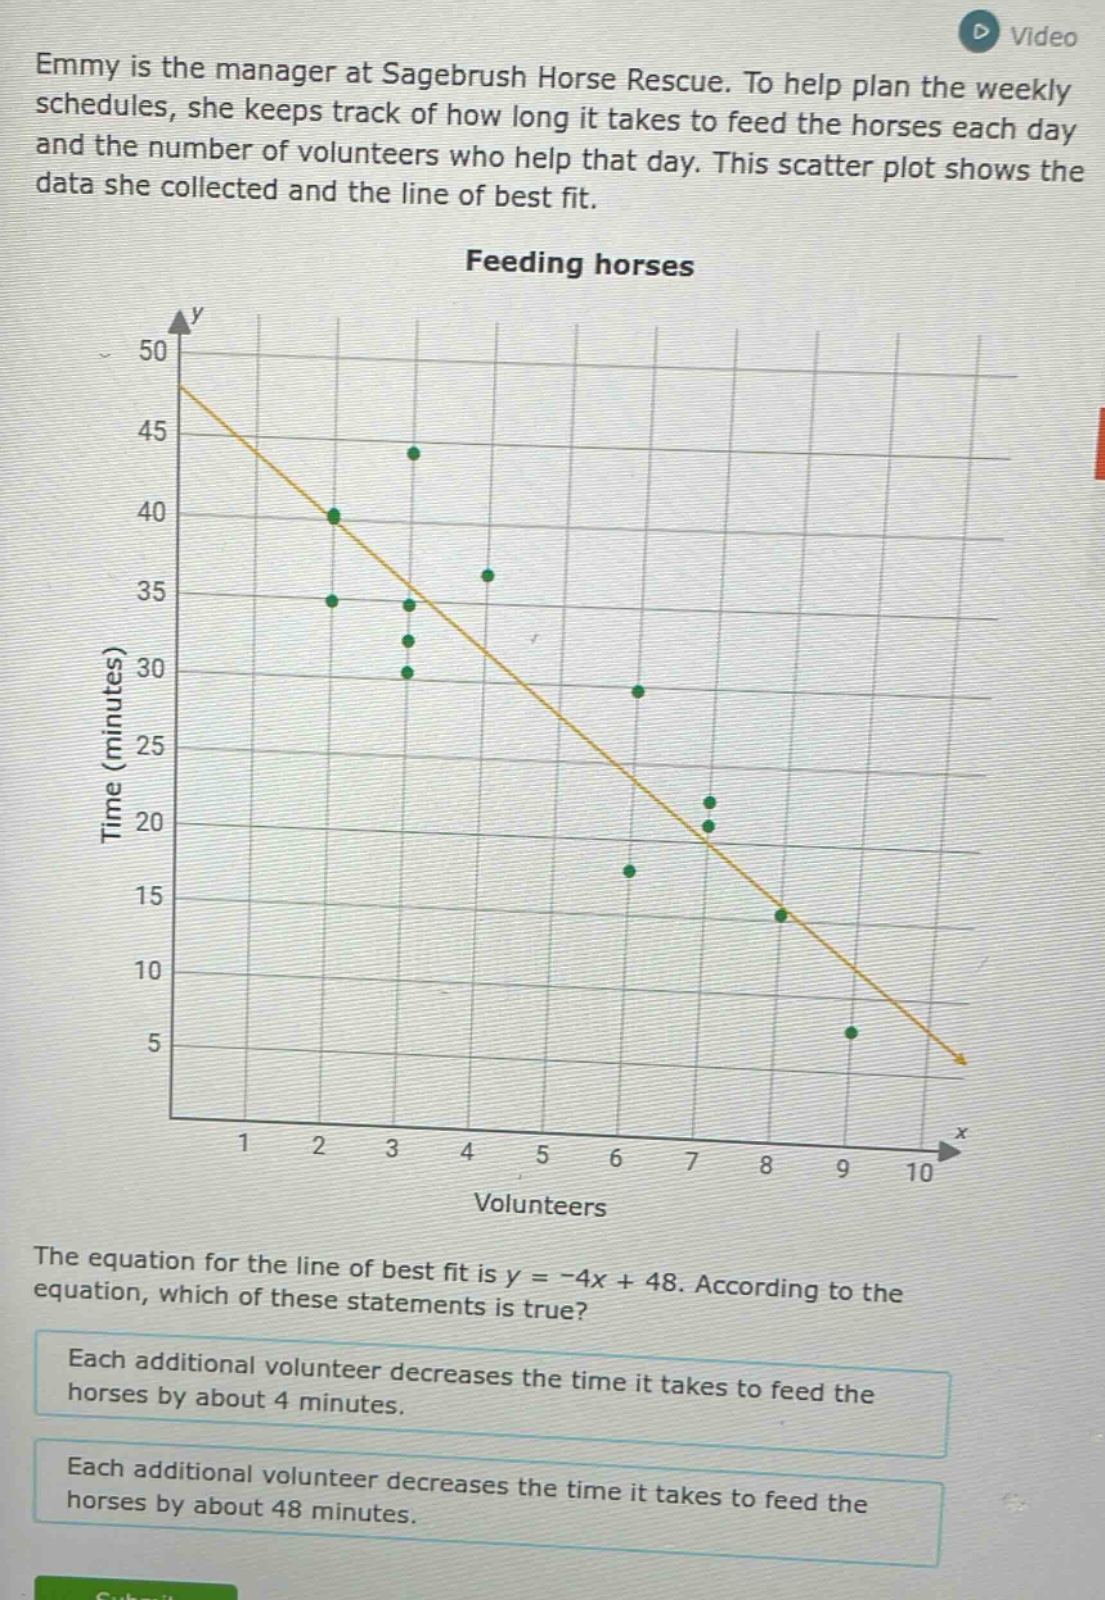
emmy is the manager at sagebrush horse rescue. to help plan the weekly schedules, she keeps track of how long it takes to feed the horses each day and the number of volunteers who help that day. this scatter plot shows the data she collected and the line of best fit. feeding horses the equation for the line of best fit is y = -4x + 48. according to the equation, which of these statements is true? each additional volunteer decreases the time it takes to feed the horses by about 4 minutes. each additional volunteer decreases the time it takes to feed the horses by about 48 minutes.
Answer
Explanation:
Step1: Analizar la ecuación de la recta
La ecuación de la recta de mejor ajuste es $y = - 4x+48$, donde $y$ es el tiempo en minutos y $x$ es el número de voluntarios. La pendiente de la recta es -4.
Step2: Interpretar la pendiente
En una ecuación lineal $y = mx + b$ (donde $m$ es la pendiente y $b$ es la intersección con el eje - y), la pendiente representa el cambio en $y$ por cada cambio unitario en $x$. Aquí, cuando $x$ (el número de voluntarios) aumenta en 1, $y$ (el tiempo de alimentación) cambia en $m=-4$. Esto significa que el tiempo disminuye en 4 minutos.
Answer:
Each additional volunteer decreases the time it takes to feed the horses by about 4 minutes.