at the end of the red river fishing contest, the judge measured the length of each fish caught.\nfish…
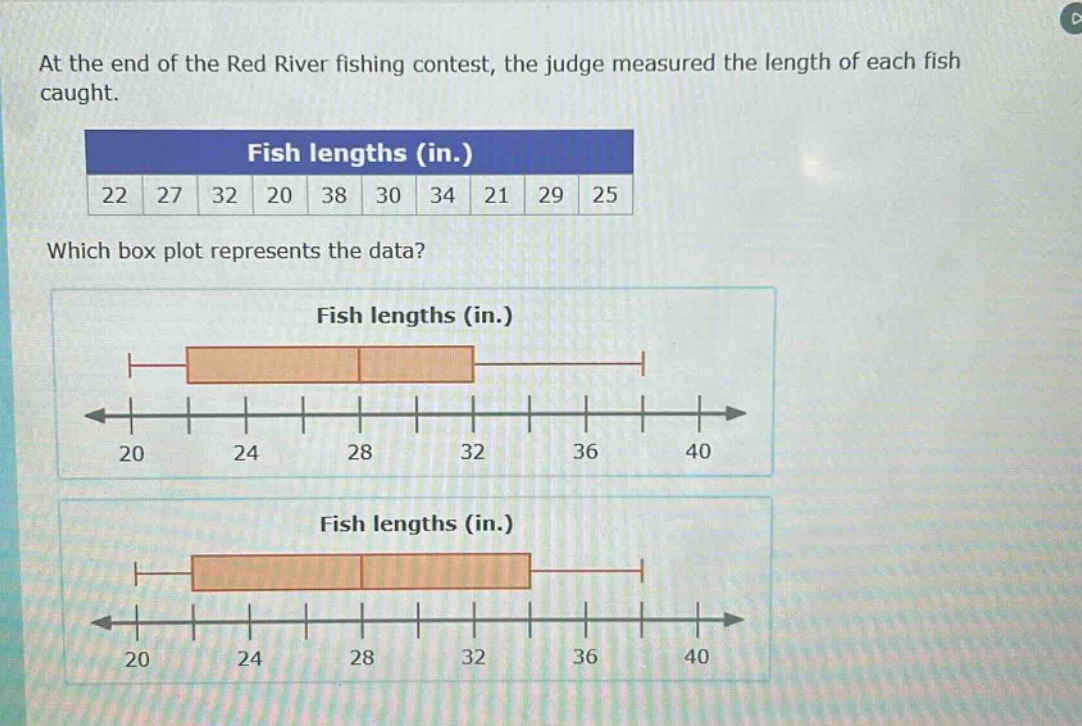
at the end of the red river fishing contest, the judge measured the length of each fish caught.\nfish lengths (in.)\n22 27 32 20 38 30 34 21 29 25\nwhich box plot represents the data?\nfish lengths (in.)\nfish lengths (in.)
Answer
Explanation:
Step1: Arrange data in ascending order
20, 21, 22, 25, 27, 29, 30, 32, 34, 38
Step2: Find the minimum value
The minimum value is 20.
Step3: Find the first - quartile ($Q_1$)
Since $n = 10$, the position of $Q_1$ is $\frac{n + 1}{4}=\frac{10+1}{4}=2.75$. So $Q_1=22+(25 - 22)\times0.75 = 22 + 2.25=24.25\approx24$.
Step4: Find the median ($Q_2$)
The position of the median is $\frac{n+1}{2}=\frac{10 + 1}{2}=5.5$. So $Q_2=\frac{27+29}{2}=28$.
Step5: Find the third - quartile ($Q_3$)
The position of $Q_3$ is $\frac{3(n + 1)}{4}=\frac{3\times(10 + 1)}{4}=8.25$. So $Q_3=32+(34 - 32)\times0.25=32 + 0.5 = 32.5\approx32$.
Step6: Find the maximum value
The maximum value is 38. The box - plot should have a minimum at 20, $Q_1$ around 24, median at 28, $Q_3$ around 32 and maximum at 38. The first box - plot represents the data.