enter values for x and y in the table to plot points in the graph. the table contains data for six students…
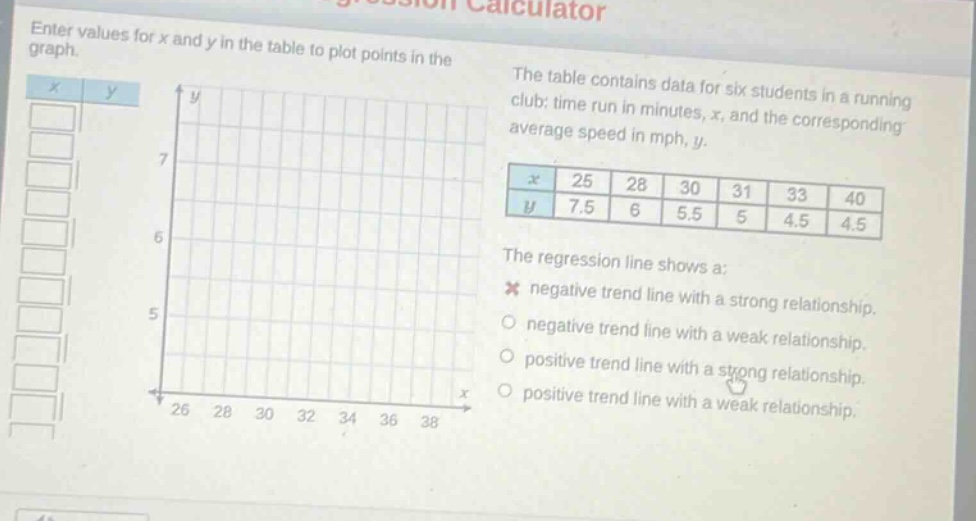
enter values for x and y in the table to plot points in the graph. the table contains data for six students in a running club: time run in minutes, x, and the corresponding average speed in mph, y. x 25 28 30 31 33 40 y 7.5 6 5.5 5 4.5 4.5 the regression line shows a: negative trend line with a strong relationship. negative trend line with a weak relationship. positive trend line with a strong relationship. positive trend line with a weak relationship.
Answer
Explanation:
Step1: Analyze the data trend
As (x) (time run in minutes) increases from 25 to 40, (y) (average speed in mph) decreases from 7.5 to 4.5. So, it is a negative - trend.
Step2: Determine the strength of the relationship
The values of (y) change in a relatively consistent manner as (x) changes. The points would likely cluster closely around a regression line, indicating a strong relationship.
Answer:
negative trend line with a strong relationship.