evaluating a prediction\nkardal did a study to determine the correlation between mens heights, x, and their…
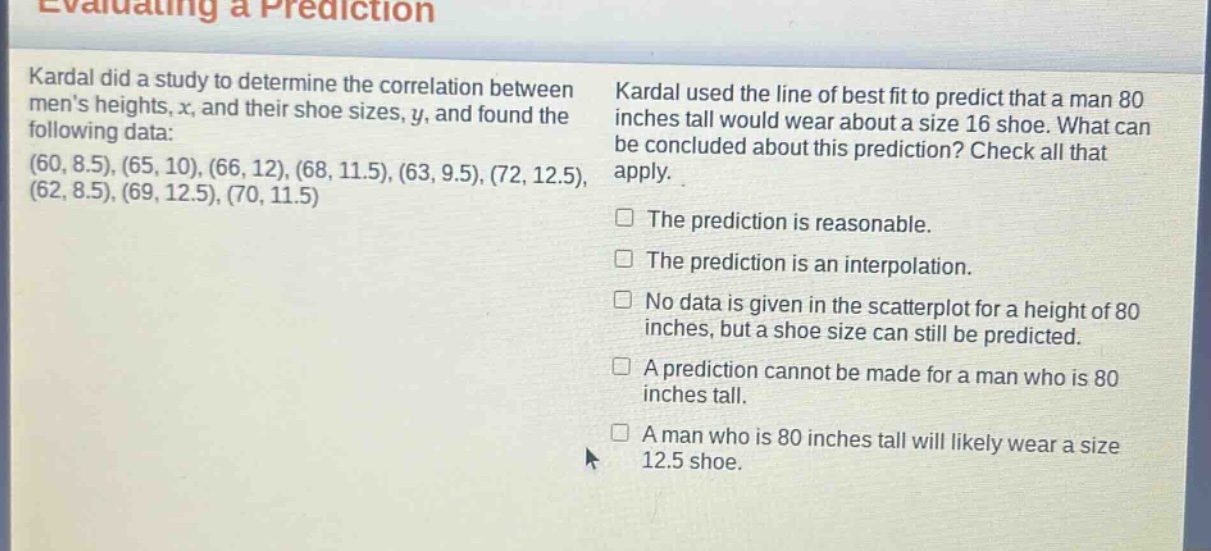
evaluating a prediction\nkardal did a study to determine the correlation between mens heights, x, and their shoe sizes, y, and found the following data: (60, 8.5), (65, 10), (66, 12), (68, 11.5), (63, 9.5), (72, 12.5), (62, 8.5), (69, 12.5), (70, 11.5)\nkardal used the line of best fit to predict that a man 80 inches tall would wear about a size 16 shoe. what can be concluded about this prediction? check all that apply.\nthe prediction is reasonable.\nthe prediction is an interpolation.\nno data is given in the scatter - plot for a height of 80 inches, but a shoe size can still be predicted.\na prediction cannot be made for a man who is 80 inches tall.\na man who is 80 inches tall will likely wear a size 12.5 shoe.
Answer
Explanation:
Step1: Analyze the data range
The given heights in the data set range from 60 to 72 inches. A height of 80 inches is outside this range.
Step2: Understand interpolation and extrapolation
Interpolation is predicting within the range of known data points, while extrapolation is predicting outside the range. Predicting for 80 - inch - tall man is extrapolation.
Step3: Evaluate the prediction
Just because 80 inches is outside the given data range doesn't mean a prediction can't be made using the line of best - fit. However, extrapolation can be less reliable. But without more information about the strength of the correlation and the line of best - fit, we can't say if the prediction of size 16 is reasonable or not.
Answer:
No data is given in the scatterplot for a height of 80 inches, but a shoe size can still be predicted.