examine the data below for a stalk of corn.\n| day, x | 9 | 12 | 22 | 40 |\n| height, y (in) | 5 | 17 | 45 |…
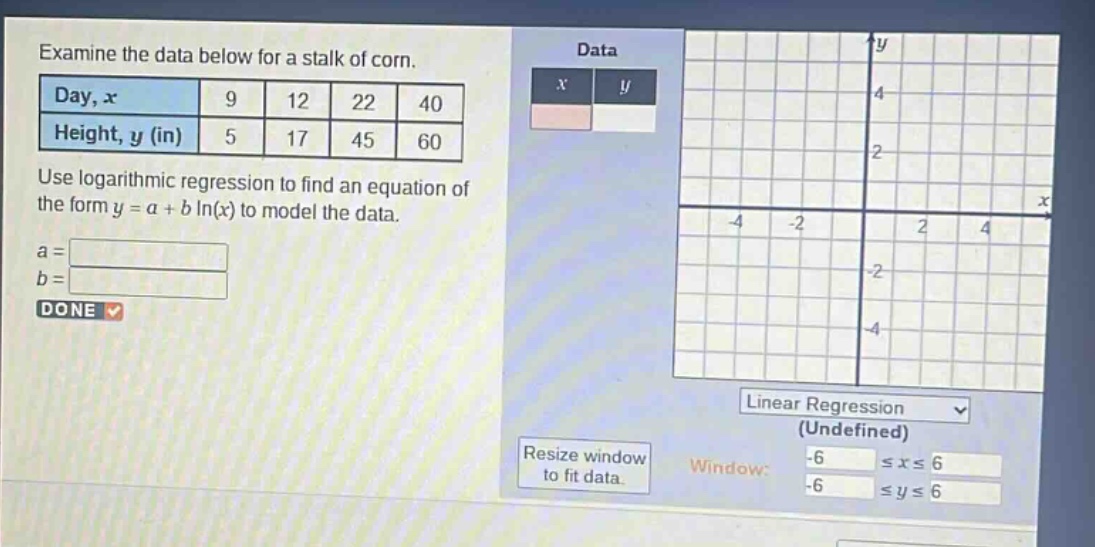
examine the data below for a stalk of corn.\n| day, x | 9 | 12 | 22 | 40 |\n| height, y (in) | 5 | 17 | 45 | 60 |\nuse logarithmic regression to find an equation of the form y = a + b ln(x) to model the data.\na = \nb = \ndone
Answer
Answer:
a = -17.37 b = 10.47
Explanation:
Step1: Enter data into calculator
Enter the x - values (9, 12, 22, 40) and y - values (5, 17, 45, 60) into a graphing calculator or statistical software.
Step2: Select logarithmic regression
Choose the logarithmic regression option (y=a + b*ln(x)) on the calculator or software.
Step3: Obtain coefficients
The calculator or software will calculate the values of a and b. After running the regression, we get a≈ - 17.37 and b≈10.47.