3. explain two ways that graphs and charts can help a scientist record their observations. (4 marks)\n4. how…
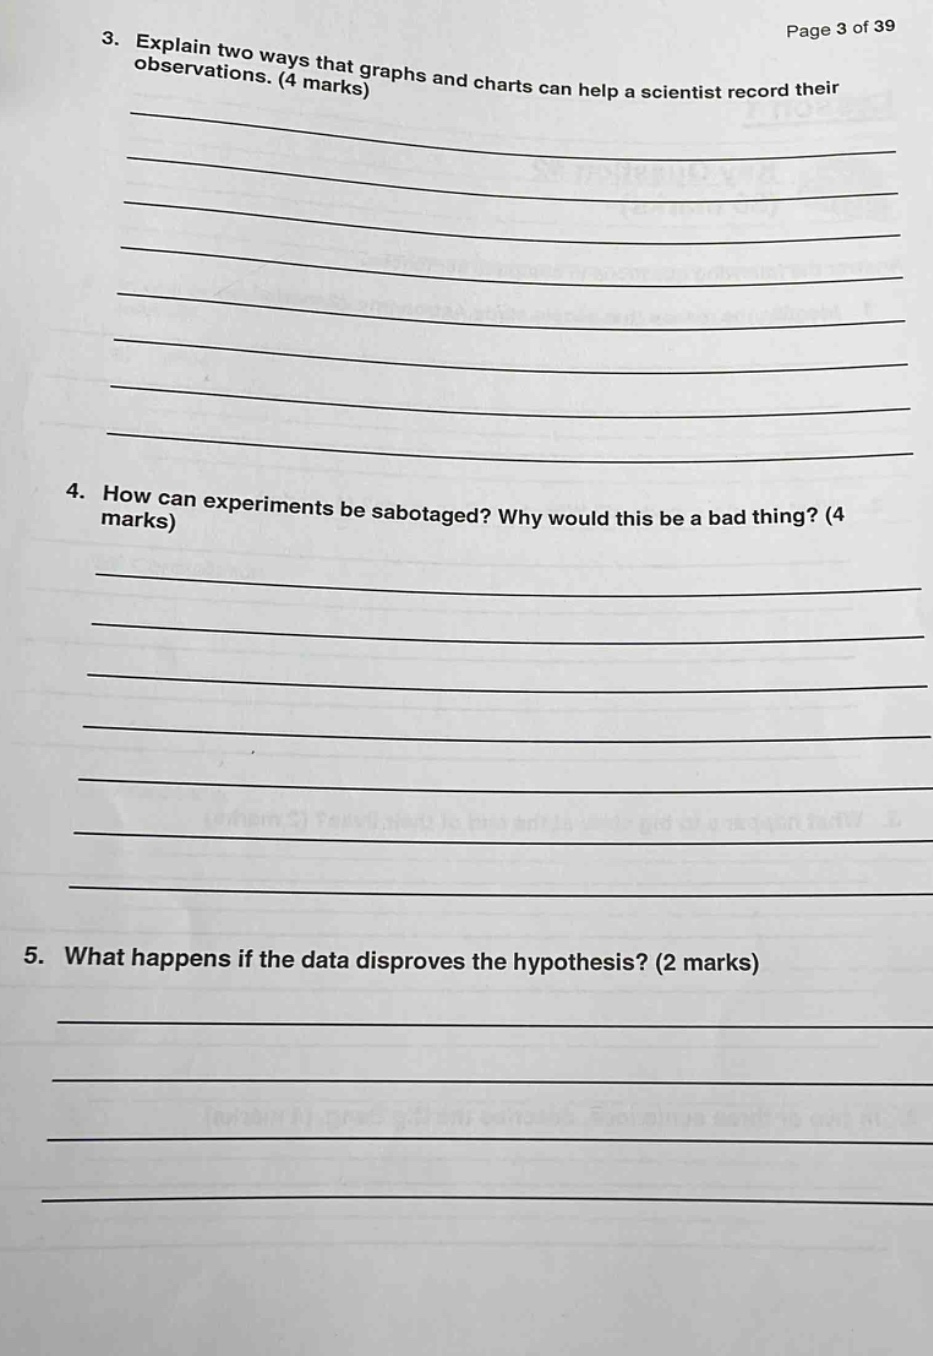
3. explain two ways that graphs and charts can help a scientist record their observations. (4 marks)\n4. how can experiments be sabotaged? why would this be a bad thing? (4 marks)\n5. what happens if the data disproves the hypothesis? (2 marks)
Answer
Brief Explanations:
Question 3:
Graphs and charts can present data visually, making it easier to identify trends and patterns. They also allow for quick comparison of different data - sets.
Question 4:
Experiments can be sabotaged by introducing incorrect variables, interfering with equipment, or manipulating data. This is bad because it leads to false results, wastes resources, and can mislead the scientific community.
Question 5:
If the data disproves the hypothesis, the scientist must reject or modify the hypothesis. This is part of the scientific process of refining understanding.
Answer:
Question 3:
- Facilitate trend - pattern identification.
- Enable data - set comparison.
Question 4:
Ways to sabotage: Introduce wrong variables, interfere with equipment, manipulate data. Bad because: Leads to false results, wastes resources, misleads the scientific community.
Question 5:
Reject or modify the hypothesis.