explain how to use the standard normal table to find the probability associated with the shaded area under…
explain how to use the standard normal table to find the probability associated with the shaded area under the curve.
Answer
Answer:
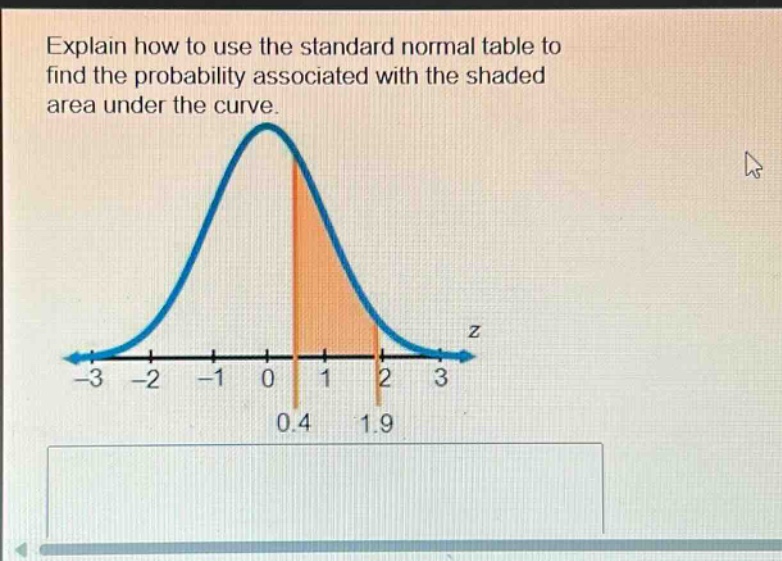
To find the probability associated with the shaded area between (z = 0.4) and (z=1.9) using the standard - normal table:
- Look up the cumulative probability for (z = 1.9) in the standard - normal table. The table gives the area to the left of (z). Let (P(Z<1.9)) be the value obtained from the table.
- Look up the cumulative probability for (z = 0.4) in the standard - normal table. Let (P(Z < 0.4)) be the value obtained from the table.
- The probability of the shaded area (P(0.4<Z<1.9)=P(Z < 1.9)-P(Z < 0.4)). Subtract the cumulative probability of (z = 0.4) from the cumulative probability of (z = 1.9) to get the probability of the area between (z = 0.4) and (z = 1.9).
Explanation:
Step1: Find (P(Z < 1.9))
Use the standard - normal table.
Step2: Find (P(Z < 0.4))
Use the standard - normal table.
Step3: Calculate (P(0.4<Z<1.9))
(P(0.4 < Z<1.9)=P(Z < 1.9)-P(Z < 0.4))