fast pax annual salaries (thousands of dollars)\nanalysts determined that the $255,000 salary is an outlier…
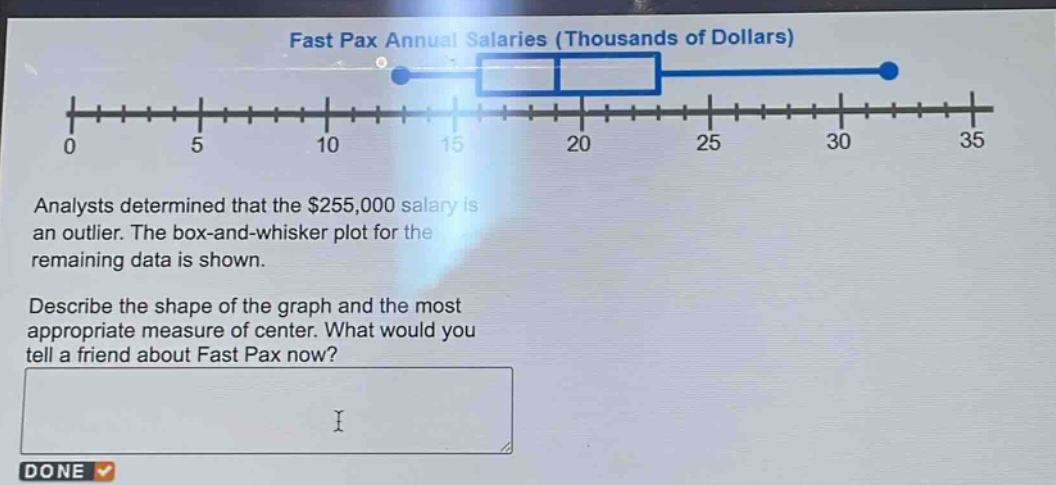
fast pax annual salaries (thousands of dollars)\nanalysts determined that the $255,000 salary is an outlier. the box - and - whisker plot for the remaining data is shown.\ndescribe the shape of the graph and the most appropriate measure of center. what would you tell a friend about fast pax now?
Answer
Brief Explanations:
The box - and - whisker plot shows that the graph is skewed right as the right whisker is longer. When there is an outlier (even after removing one, the data may still be affected), the median is the most appropriate measure of center as it is not influenced by extreme values. You could tell your friend that the majority of Fast Pax employees have salaries in the lower range (as indicated by the median and the left - side of the box - and - whisker plot), and there are some relatively high salaries pulling the distribution to the right.
Answer:
The shape of the graph is skewed right. The most appropriate measure of center is the median. You could tell a friend that most employees have relatively lower salaries and there are some higher salaries that skew the distribution.