after a field trip to the planetarium, ms. trevino gave her students a pop quiz. she recorded how many…
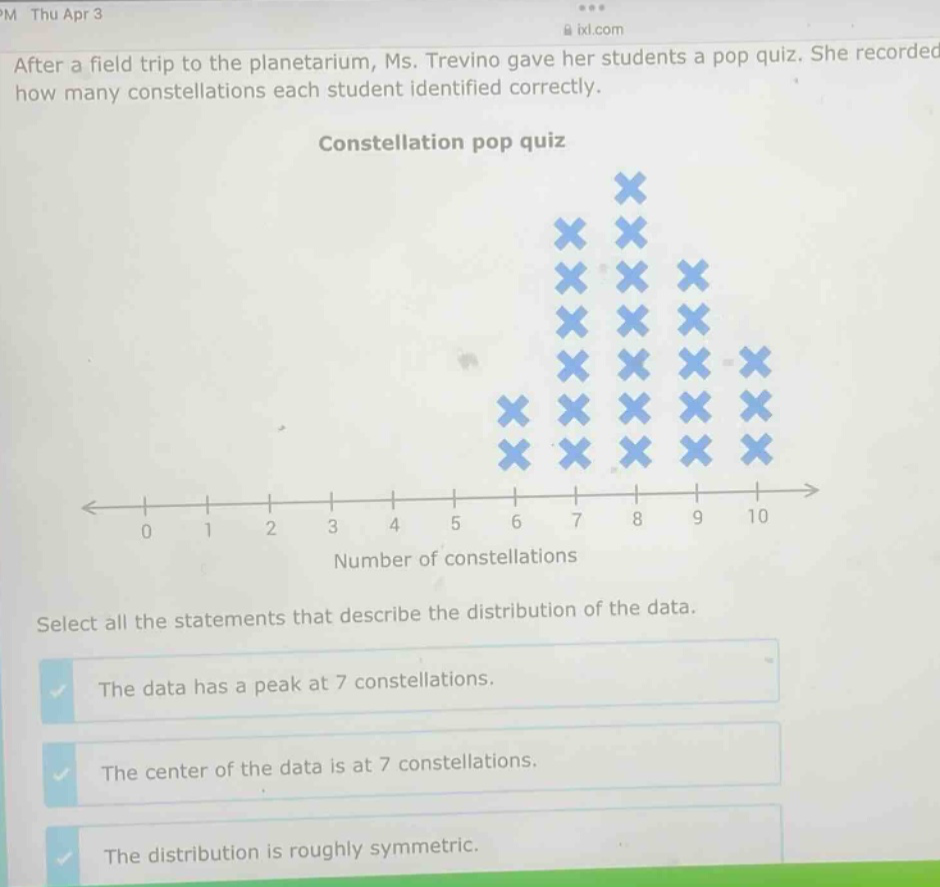
after a field trip to the planetarium, ms. trevino gave her students a pop quiz. she recorded how many constellations each student identified correctly. constellation pop quiz select all the statements that describe the distribution of the data. the data has a peak at 7 constellations. the center of the data is at 7 constellations. the distribution is roughly symmetric.
Answer
Explanation:
Step1: Identify peak
Count the number of 'X's for each value on the number - line. The most 'X's are at 7, so there is a peak at 7 constellations.
Step2: Determine center
To find the center (median), arrange the data in order. Since the data seems to be balanced around 7, the center is at 7 constellations.
Step3: Check symmetry
The data on the left - hand side of 7 (values 6, 5) and the data on the right - hand side of 7 (values 8, 9, 10) are somewhat mirror - images of each other, so the distribution is roughly symmetric.
Answer:
The data has a peak at 7 constellations. The center of the data is at 7 constellations. The distribution is roughly symmetric.