the figure illustrates a normal distribution for the prices paid for a particular model of a new car. the…
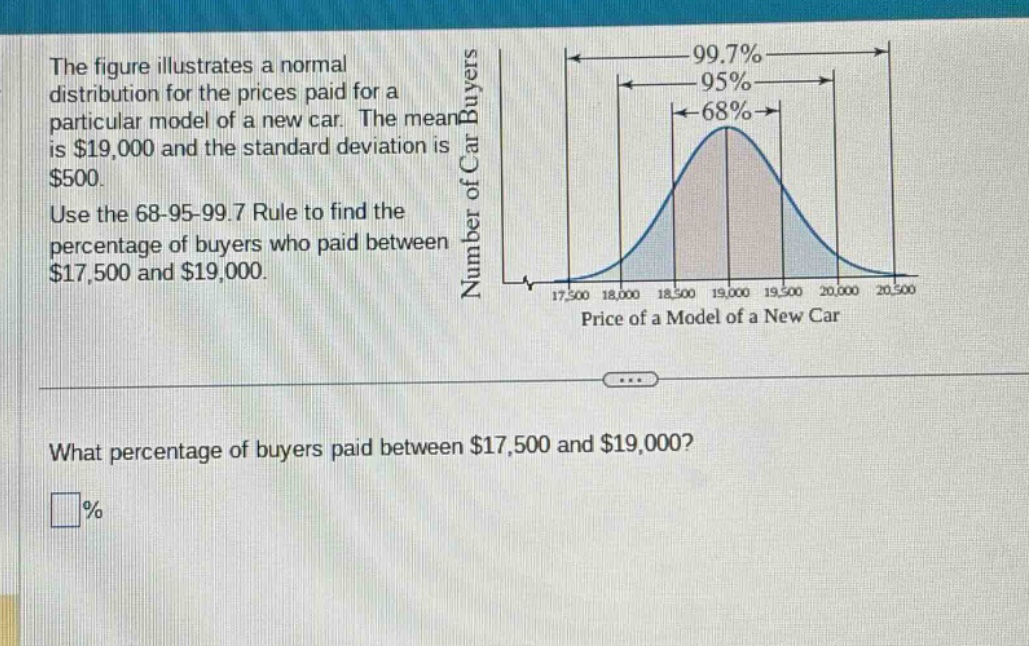
the figure illustrates a normal distribution for the prices paid for a particular model of a new car. the mean is $19,000 and the standard deviation is $500. use the 68 - 95 - 99.7 rule to find the percentage of buyers who paid between $17,500 and $19,000. what percentage of buyers paid between $17,500 and $19,000? %
Answer
Explanation:
Step1: Calculate number of standard - deviations
The mean $\mu = 19000$ and the standard deviation $\sigma=500$. To find how many standard - deviations $17500$ is from the mean, we use the formula $z=\frac{x - \mu}{\sigma}$. So, $z=\frac{17500 - 19000}{500}=\frac{- 1500}{500}=-3$.
Step2: Apply the 68 - 95 - 99.7 Rule
The 68 - 95 - 99.7 Rule states that about 68% of the data lies within 1 standard deviation of the mean, about 95% lies within 2 standard deviations, and about 99.7% lies within 3 standard deviations of the mean. The normal distribution is symmetric about the mean. The percentage of data between $\mu - 3\sigma$ and $\mu$ is half of the percentage of data between $\mu - 3\sigma$ and $\mu+3\sigma$. Since the percentage of data between $\mu - 3\sigma$ and $\mu + 3\sigma$ is 99.7%, the percentage of data between $\mu - 3\sigma$ and $\mu$ is $\frac{99.7%}{2}=49.85%$.
Answer:
49.85