find the area of the shaded region. the graph depicts the standard normal distribution of bone density…
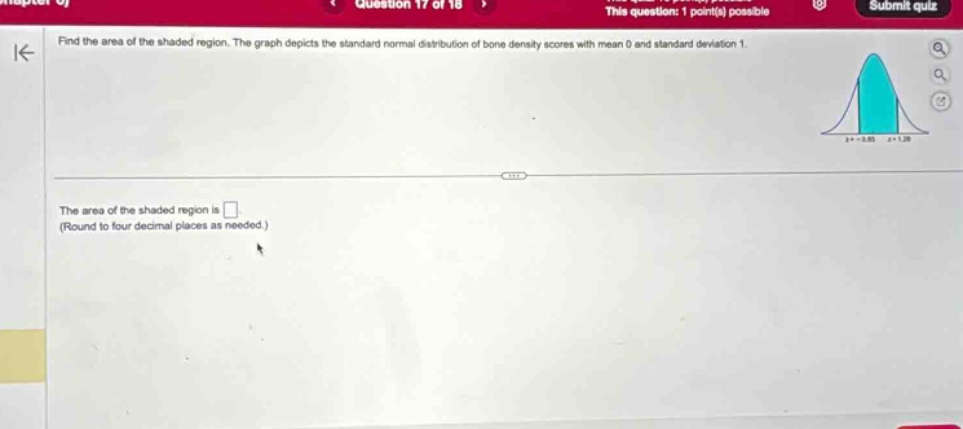
find the area of the shaded region. the graph depicts the standard normal distribution of bone density scores with mean 0 and standard deviation 1. the area of the shaded region is . (round to four decimal places as needed.)
Answer
Explanation:
Step1: Use z - table
We need to find the cumulative - distribution function values for the given z - scores. Let (z_1=-0.88) and (z_2 = 1.38). The area under the standard normal curve between two z - scores (z_1) and (z_2) is (P(-0.88<Z<1.38)=P(Z < 1.38)-P(Z < - 0.88)).
Step2: Look up values in z - table
From the standard normal distribution table (z - table), (P(Z < 1.38)=0.9162) and (P(Z < - 0.88)=0.1894).
Step3: Calculate the area
(P(-0.88<Z<1.38)=0.9162 - 0.1894=0.7268)
Answer:
0.7268