find the area of the shaded region. the graph depicts the standard normal distribution with mean 0 and…
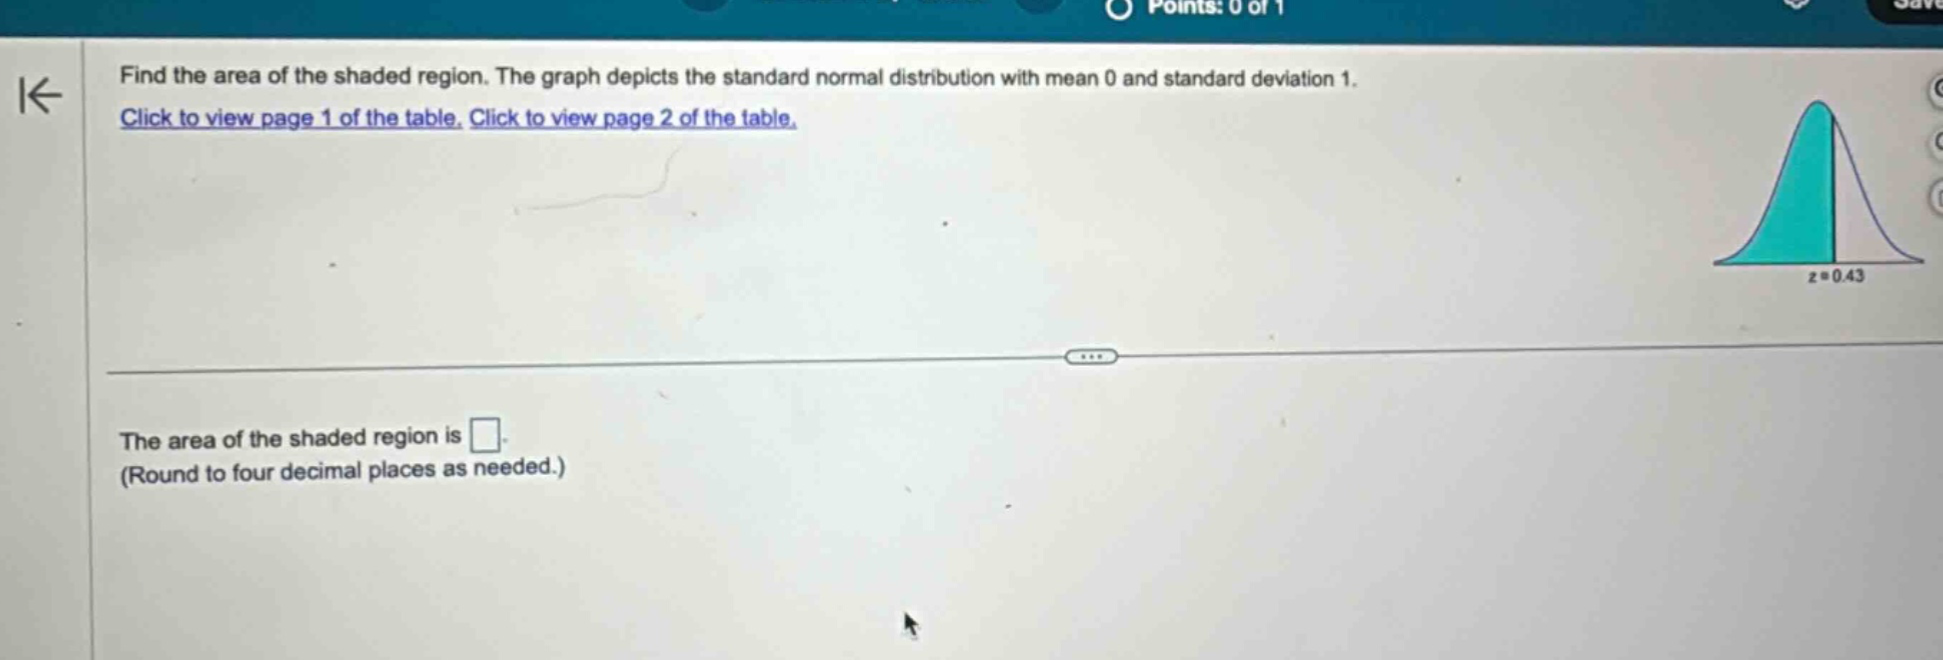
find the area of the shaded region. the graph depicts the standard normal distribution with mean 0 and standard deviation 1. click to view page 1 of the table. click to view page 2 of the table. the area of the shaded region is \n(round to four decimal places as needed.)
Answer
Explanation:
Step1: Use z - table lookup
We look up the value of the cumulative - distribution function of the standard normal distribution $\varPhi(z)$ for $z = 0.43$ in the standard normal table.
Step2: Find the area
The standard normal table gives the area to the left of a given $z$ - value. For $z=0.43$, looking up in the standard normal table, we find that $\varPhi(0.43)=0.6664$.
Answer:
$0.6664$