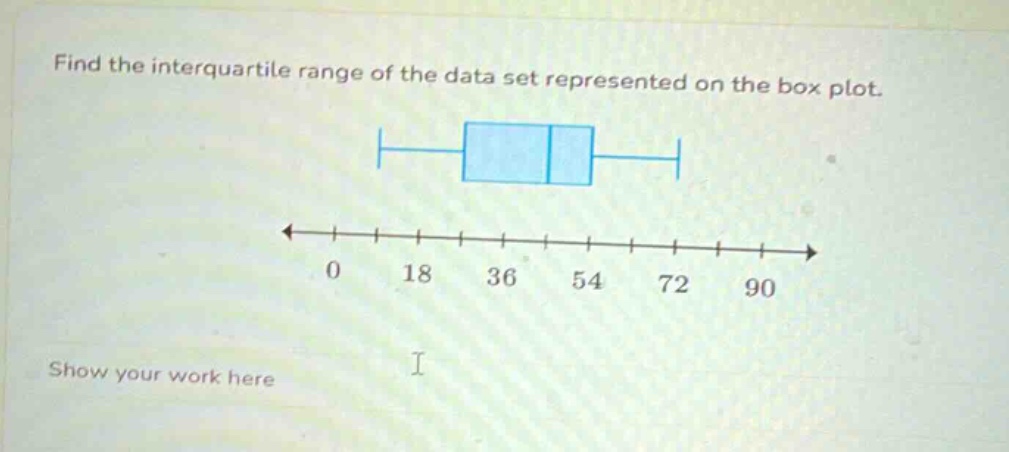
find the interquartile range of the data set represented on the box plot. show your work here
find the interquartile range of the data set represented on the box plot. show your work here
Answer
Answer:
27
Explanation:
Step1: Identify the first quartile (Q1).
The first quartile (Q1) is represented by the left edge of the box. From the box plot, the left edge of the box is at 27. $$ Q1 = 27 $$
Step2: Identify the third quartile (Q3).
The third quartile (Q3) is represented by the right edge of the box. From the box plot, the right edge of the box is at 54. $$ Q3 = 54 $$
Step3: Calculate the interquartile range (IQR).
The interquartile range (IQR) is the difference between the third quartile (Q3) and the first quartile (Q1). $$ IQR = Q3 - Q1 $$ $$ IQR = 54 - 27 $$ $$ IQR = 27 $$