find the mean absolute deviation given the dot plot below.\nshow your work here
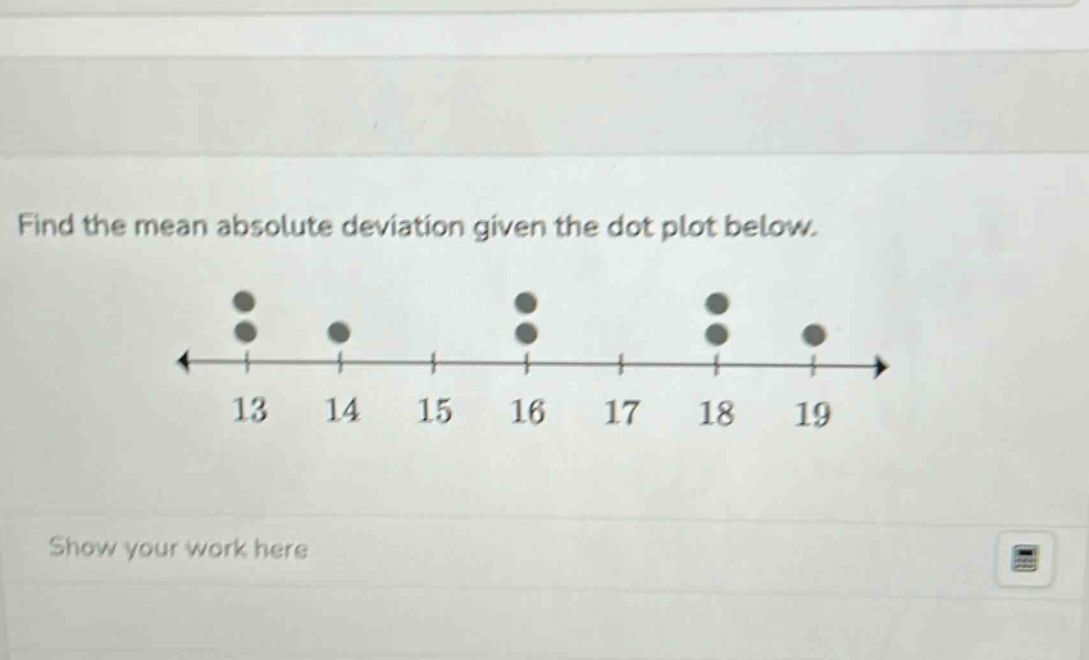
find the mean absolute deviation given the dot plot below.\nshow your work here
Answer
Explanation:
Step1: Calculate the mean
The data - set from the dot - plot is (13,13,14,16,16,18,18,19). The sum of the data values is (13 + 13+14 + 16+16+18+18+19=127). The number of data points (n = 8). The mean (\bar{x}=\frac{127}{8}=15.875).
Step2: Calculate the absolute deviations
For (x_1 = 13), (\vert x_1-\bar{x}\vert=\vert13 - 15.875\vert = 2.875) (twice since there are two 13s). For (x_2 = 14), (\vert x_2-\bar{x}\vert=\vert14 - 15.875\vert = 1.875). For (x_3 = 16), (\vert x_3-\bar{x}\vert=\vert16 - 15.875\vert = 0.125) (twice since there are two 16s). For (x_4 = 18), (\vert x_4-\bar{x}\vert=\vert18 - 15.875\vert = 2.125) (twice since there are two 18s). For (x_5 = 19), (\vert x_5-\bar{x}\vert=\vert19 - 15.875\vert = 3.125).
Step3: Calculate the sum of absolute deviations
The sum of absolute deviations is (2\times2.875+1.875 + 2\times0.125+2\times2.125+3.125) (=5.75+1.875 + 0.25+4.25+3.125) (=15.25).
Step4: Calculate the mean absolute deviation
The mean absolute deviation (MAD=\frac{15.25}{8}=1.90625).
Answer:
(1.90625)