find the residual values, and use the graphing calculator tool to make a residual plot. does the residual…
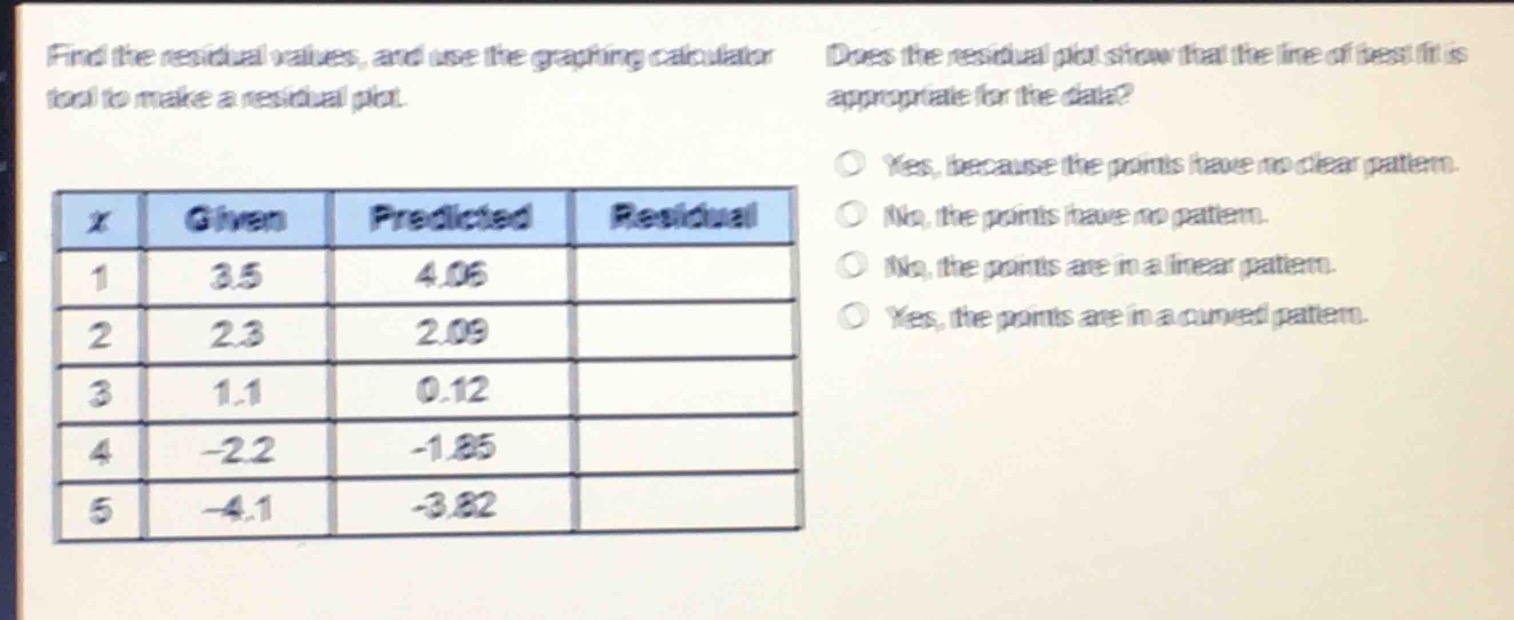
find the residual values, and use the graphing calculator tool to make a residual plot. does the residual plot show that the line of best fit is appropriate for the data?\n|x|given|predicted|residual|\n|----|----|----|----|\n|1|3.5|4.06|\n|2|2.3|2.09|\n|3|1.1|0.12|\n|4|-2.2|-1.85|\n|5|-4.1|-3.82|\nyes, because the points have no clear pattern.\nno, the points have no pattern.\nno, the points are in a linear pattern.\nyes, the points are in a curved pattern.
Answer
Explanation:
Step1: Recall residual formula
Residual = Given - Predicted
Step2: Calculate residual for (x = 1)
Residual (=3.5 - 4.06=- 0.56)
Step3: Calculate residual for (x = 2)
Residual (=2.3 - 2.09 = 0.21)
Step4: Calculate residual for (x = 3)
Residual (=1.1 - 0.12=0.98)
Step5: Calculate residual for (x = 4)
Residual (=-2.2-(-1.85)=-2.2 + 1.85=-0.35)
Step6: Calculate residual for (x = 5)
Residual (=-4.1-(-3.82)=-4.1 + 3.82=-0.28)
Step7: Determine if line of best - fit is appropriate
A residual plot with no clear pattern indicates that the line of best - fit is appropriate. Points with no pattern mean the model is a good fit.
Answer:
| (x) | Given | Predicted | Residual |
|---|---|---|---|
| 1 | 3.5 | 4.06 | - 0.56 |
| 2 | 2.3 | 2.09 | 0.21 |
| 3 | 1.1 | 0.12 | 0.98 |
| 4 | -2.2 | -1.85 | -0.35 |
| 5 | -4.1 | -3.82 | -0.28 |
| Yes, because the points have no clear pattern. |