find the residual values, and use the graphing calculator tool to make a residual plot.\ndoes the residual…
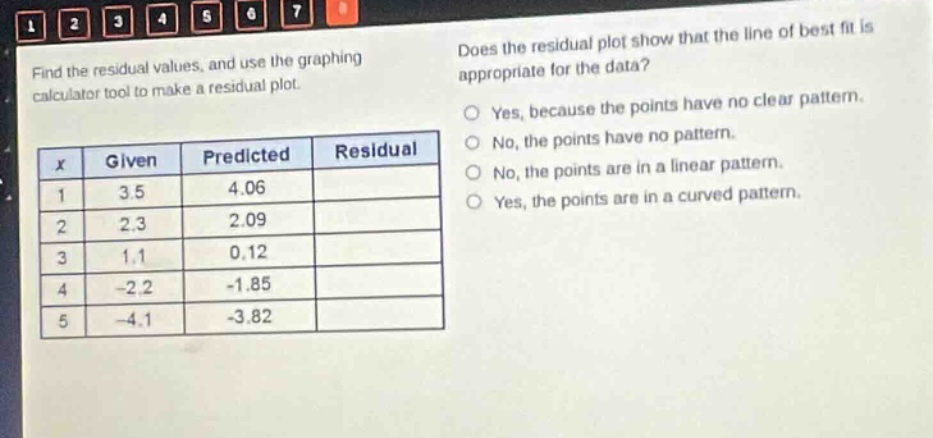
find the residual values, and use the graphing calculator tool to make a residual plot.\ndoes the residual plot show that the line of best fit is appropriate for the data?\nyes, because the points have no clear pattern.\nno, the points have no pattern.\nno, the points are in a linear pattern.\nyes, the points are in a curved pattern.\n|x|given|predicted|residual|\n|1|3.5|4.06|\n|2|2.3|2.09|\n|3|1.1|0.12|\n|4|-2.2|-1.85|\n|5|-4.1|-3.82|
Answer
Answer:
- Residual values:
- For (x = 1): (3.5−4.06=- 0.56)
- For (x = 2): (2.3 - 2.09 = 0.21)
- For (x = 3): (1.1-0.12 = 0.98)
- For (x = 4): (-2.2-(-1.85)=-2.2 + 1.85=-0.35)
- For (x = 5): (-4.1-(-3.82)=-4.1 + 3.82=-0.28)
- Answer to the second - part: Yes, because the points have no clear pattern.
Explanation:
Step1: Calculate residual for (x = 1)
Residual=Given - Predicted, so (3.5−4.06=-0.56)
Step2: Calculate residual for (x = 2)
Residual = (2.3 - 2.09=0.21)
Step3: Calculate residual for (x = 3)
Residual = (1.1 - 0.12 = 0.98)
Step4: Calculate residual for (x = 4)
Residual=(-2.2-(-1.85)=-0.35)
Step5: Calculate residual for (x = 5)
Residual=(-4.1-(-3.82)=-0.28)
Step6: Determine line - of - best - fit appropriateness
A residual plot with no clear pattern (randomly scattered points) indicates that the line of best fit is appropriate for the data.