find the residual values, and use the graphing calculator tool to make a residual plot.\n|x|given|predicted|r…
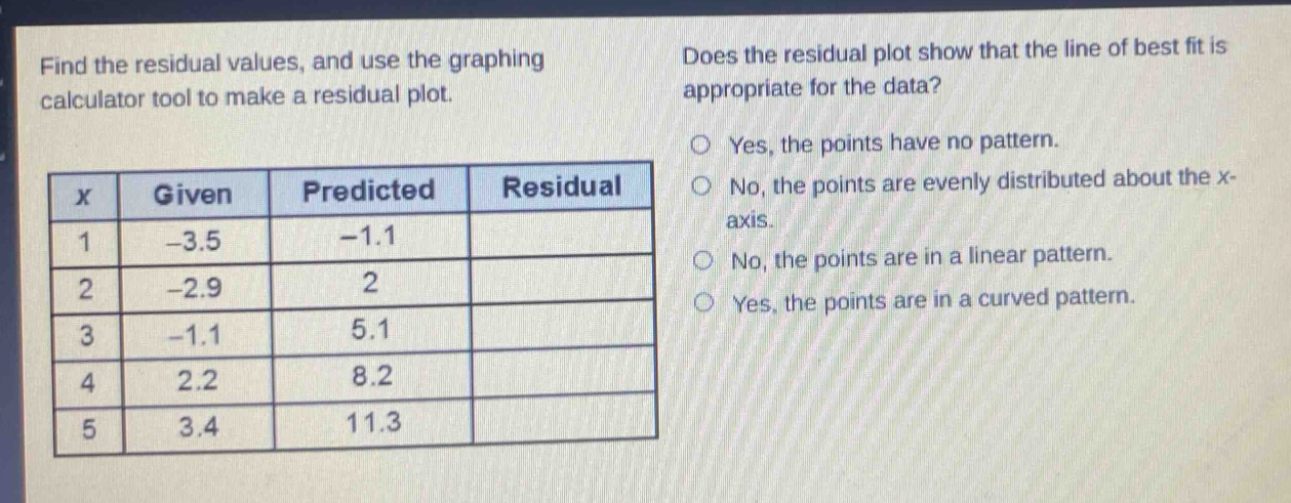
find the residual values, and use the graphing calculator tool to make a residual plot.\n|x|given|predicted|residual|\n|----|----|----|----|\n|1|-3.5|-1.1|\n|2|-2.9|2|\n|3|-1.1|5.1|\n|4|2.2|8.2|\n|5|3.4|11.3|\ndoes the residual plot show that the line of best fit is appropriate for the data?\nyes, the points have no pattern.\nno, the points are evenly distributed about the x - axis.\nno, the points are in a linear pattern.\nyes, the points are in a curved pattern.
Answer
Answer:
| x | Given | Predicted | Residual |
|---|---|---|---|
| 1 | -3.5 | -1.1 | -3.5 - (-1.1)= - 2.4 |
| 2 | -2.9 | 2 | -2.9 - 2=-4.9 |
| 3 | -1.1 | 5.1 | -1.1 - 5.1=-6.2 |
| 4 | 2.2 | 8.2 | 2.2 - 8.2=-6 |
| 5 | 3.4 | 11.3 | 3.4 - 11.3=-7.9 |
The answer to the multiple - choice question is: No, the points are in a linear pattern.
Explanation:
Step1: Recall the formula for residual
Residual = Observed value - Predicted value
Step2: Calculate residual for x = 1
Residual = -3.5-(-1.1)=-3.5 + 1.1=-2.4
Step3: Calculate residual for x = 2
Residual=-2.9 - 2=-4.9
Step4: Calculate residual for x = 3
Residual=-1.1 - 5.1=-6.2
Step5: Calculate residual for x = 4
Residual=2.2 - 8.2=-6
Step6: Calculate residual for x = 5
Residual=3.4 - 11.3=-7.9
Step7: Analyze residual plot concept
A good fit has randomly - scattered residuals. A linear pattern in residuals indicates a poor fit. So the answer to the multiple - choice is that the points are in a linear pattern, meaning the line of best fit is not appropriate.