find the z - value that corresponds to the given area in the figure below. use the standard normal…
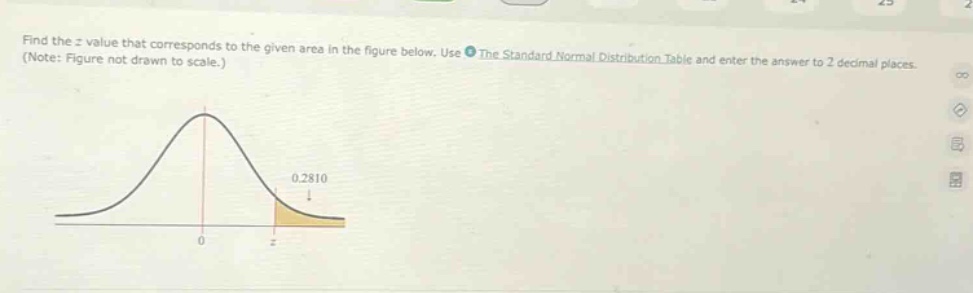
find the z - value that corresponds to the given area in the figure below. use the standard normal distribution table and enter the answer to 2 decimal places. (note: figure not drawn to scale.)
Answer
Answer:
0.58
Explanation:
Step1: Understand the table use
The standard - normal distribution table gives the area to the left of a z - value. The area to the left of z is (1 - 0.2810=0.7190).
Step2: Look up in the table
We look for the value closest to 0.7190 in the body of the standard - normal distribution table. The closest value in the table corresponds to a z - value of 0.58.