find the variance of the probability distribution for the histogram shown.
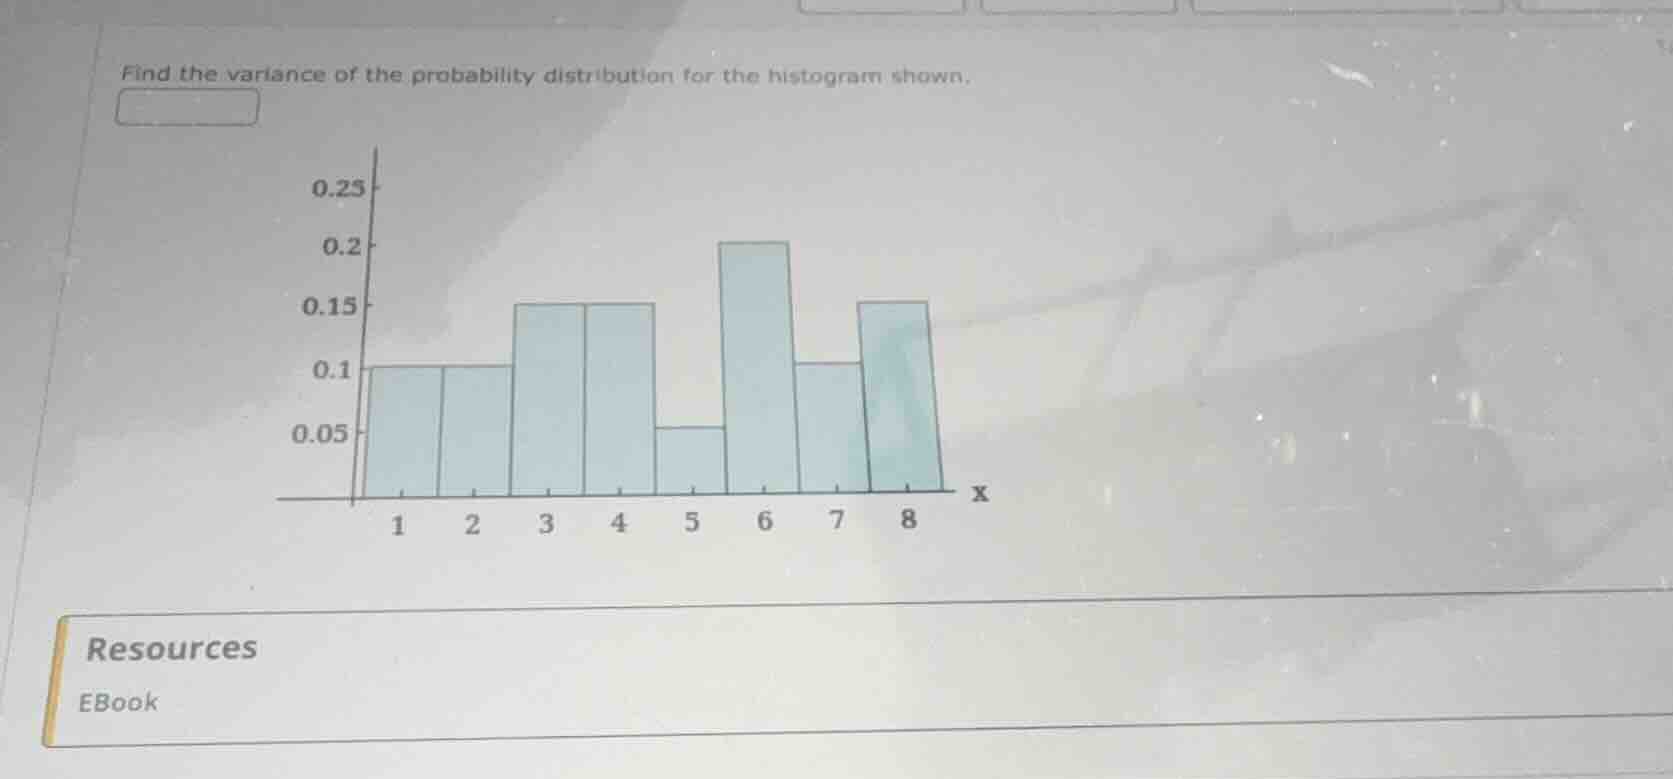
find the variance of the probability distribution for the histogram shown.
Answer
Explanation:
Step1: Identify probabilities from the histogram
The probabilities $P(x)$ for $x = 1, 2, \dots, 8$ are: $P(1)=0.1, P(2)=0.1, P(3)=0.15, P(4)=0.15, P(5)=0.05, P(6)=0.2, P(7)=0.1, P(8)=0.15$.
Step2: Calculate the expected value $\mu$
$\mu = \sum x \cdot P(x)$ $\mu = (1 \cdot 0.1) + (2 \cdot 0.1) + (3 \cdot 0.15) + (4 \cdot 0.15) + (5 \cdot 0.05) + (6 \cdot 0.2) + (7 \cdot 0.1) + (8 \cdot 0.15) = 4.7$
Step3: Calculate the expected value of $x^2$
$E[X^2] = \sum x^2 \cdot P(x)$ $E[X^2] = (1^2 \cdot 0.1) + (2^2 \cdot 0.1) + (3^2 \cdot 0.15) + (4^2 \cdot 0.15) + (5^2 \cdot 0.05) + (6^2 \cdot 0.2) + (7^2 \cdot 0.1) + (8^2 \cdot 0.15) = 26.8$
Step4: Calculate the variance $\sigma^2$
$\sigma^2 = E[X^2] - \mu^2$ $\sigma^2 = 26.8 - (4.7)^2 = 26.8 - 22.09 = 4.71$
Answer:
4.71