five marbles labeled 1 through 5 are placed in a bag. a marble is randomly pulled and the number is recorded…
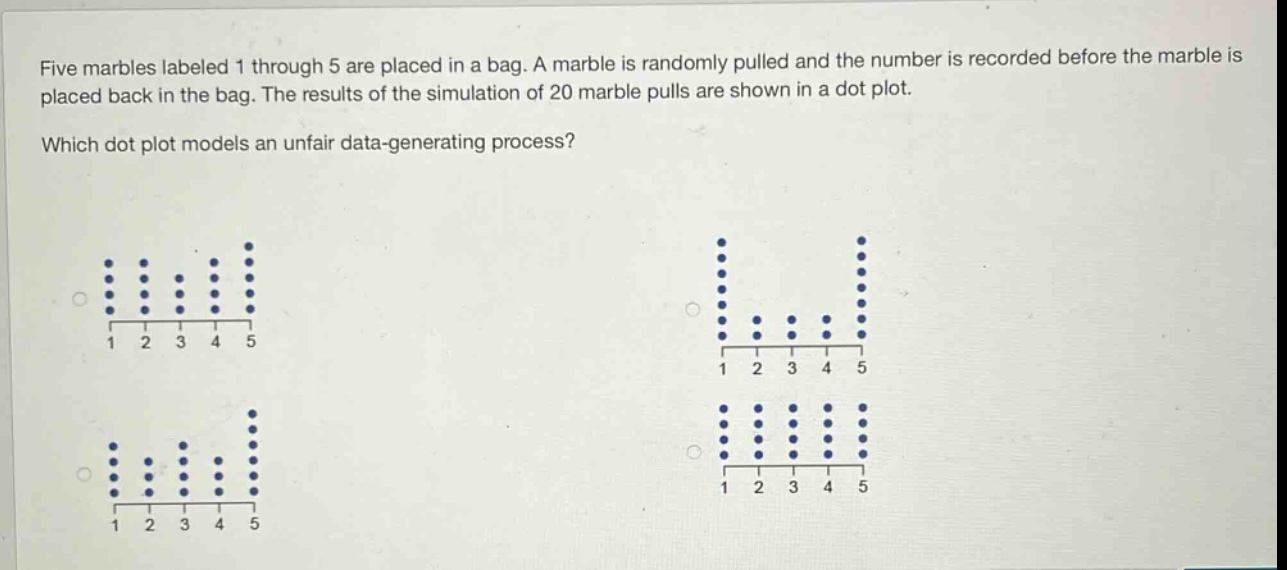
five marbles labeled 1 through 5 are placed in a bag. a marble is randomly pulled and the number is recorded before the marble is placed back in the bag. the results of the simulation of 20 marble pulls are shown in a dot - plot. which dot plot models an unfair data - generating process?
Answer
Explanation:
Step1: Understand fair - unfair concept
In a fair data - generating process with 5 equally likely outcomes (marbles 1 - 5), the frequencies of each outcome should be approximately equal when the number of trials is large enough. Here, we have 20 trials.
Step2: Analyze dot - plots
For a fair process, we expect the number of dots for each number (1 - 5) to be close to $\frac{20}{5}=4$.
- In the first dot - plot, the frequencies are relatively close to 4 for each number.
- In the second dot - plot, the frequency of 1 is much higher and the frequencies of 2, 3, 4 are much lower than expected, which indicates an unfair process.
- In the third dot - plot, the frequencies are somewhat spread out but still relatively close to an even distribution.
- In the fourth dot - plot, the frequencies are also relatively close to an even distribution.