the following data are the ages (in years) of 17 statistics teachers in a school district. 53, 52, 53, 47…
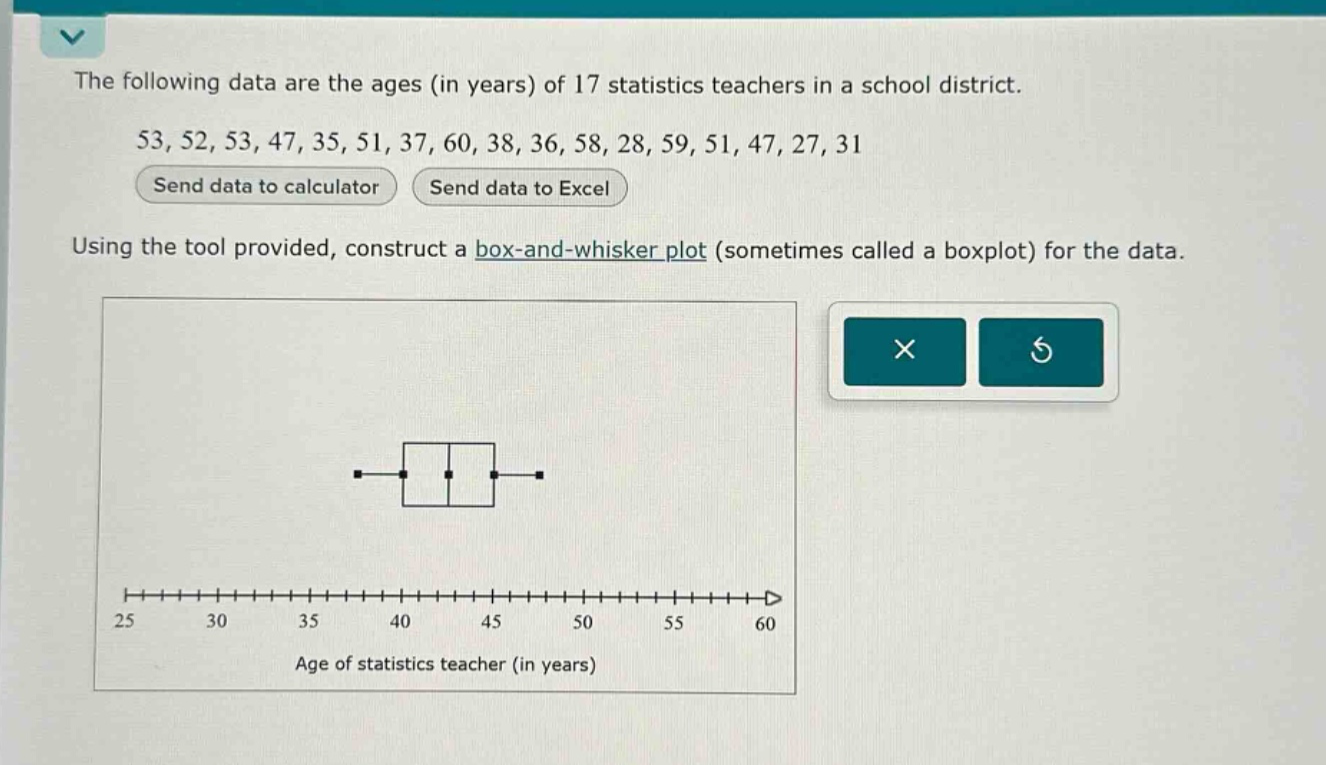
the following data are the ages (in years) of 17 statistics teachers in a school district. 53, 52, 53, 47, 35, 51, 37, 60, 38, 36, 58, 28, 59, 51, 47, 27, 31 send data to calculator send data to excel using the tool provided, construct a box - and - whisker plot (sometimes called a boxplot) for the data. age of statistics teacher (in years)
Answer
Explanation:
Step1: Arrange data in ascending order
27, 28, 31, 35, 36, 37, 38, 47, 47, 51, 51, 52, 53, 53, 58, 59, 60
Step2: Find the minimum value
The minimum value is 27.
Step3: Find the first - quartile ($Q_1$)
Since $n = 17$, the position of $Q_1$ is $\frac{n + 1}{4}=\frac{17+1}{4}=4.5$. So $Q_1=\frac{35 + 36}{2}=35.5$.
Step4: Find the median ($Q_2$)
The position of the median is $\frac{n + 1}{2}=\frac{17+1}{2}=9$. So the median $Q_2 = 47$.
Step5: Find the third - quartile ($Q_3$)
The position of $Q_3$ is $\frac{3(n + 1)}{4}=\frac{3\times(17 + 1)}{4}=13.5$. So $Q_3=\frac{53+53}{2}=53$.
Step6: Find the maximum value
The maximum value is 60.
Answer:
To construct the box - and - whisker plot:
- The left - most point (the end of the left whisker) is at 27.
- The left side of the box is at $Q_1 = 35.5$.
- The line inside the box is at the median $Q_2=47$.
- The right side of the box is at $Q_3 = 53$.
- The right - most point (the end of the right whisker) is at 60.