for the following data, find the correlation coefficient. does the line of best fit have positive…
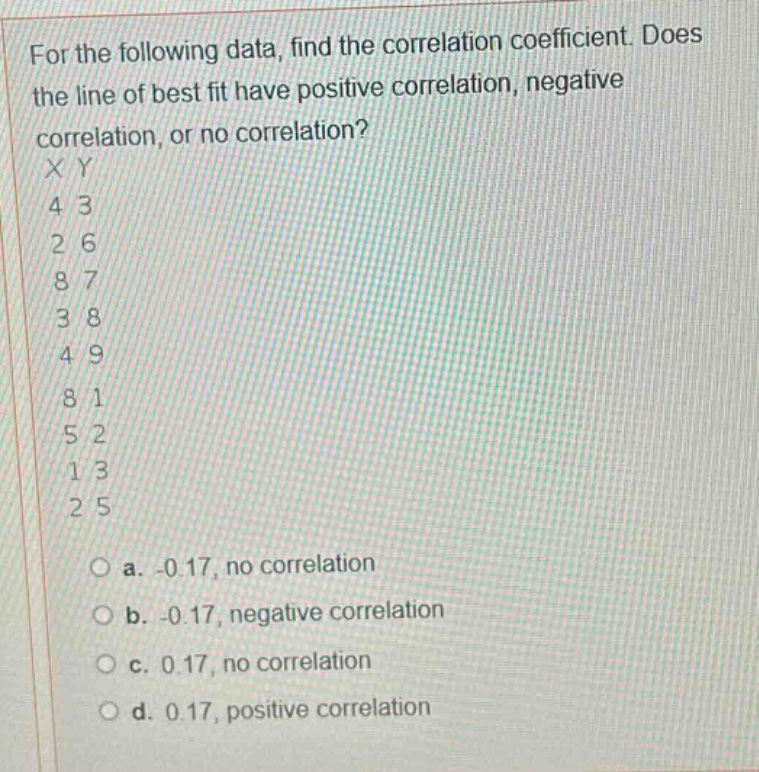
for the following data, find the correlation coefficient. does the line of best fit have positive correlation, negative correlation, or no correlation?\nx y\n4 3\n2 6\n8 7\n3 8\n4 9\n8 1\n5 2\n1 3\n2 5\n\na. -0.17, no correlation\nb. -0.17, negative correlation\nc. 0.17, no correlation\nd. 0.17, positive correlation
Answer
Answer:
B. -0.17, negative correlation
Explanation:
Step1: Recall correlation coefficient concept
The correlation coefficient $r$ ranges from - 1 to 1. If $r>0$, it's positive correlation; if $r < 0$, it's negative correlation; if $r$ is close to 0, it's no correlation.
Step2: Analyze given value
Here $r=-0.17$. Since $r=-0.17<0$, it indicates a negative correlation.