the following data points represent the number of trick - or - treaters james had each year since he started…
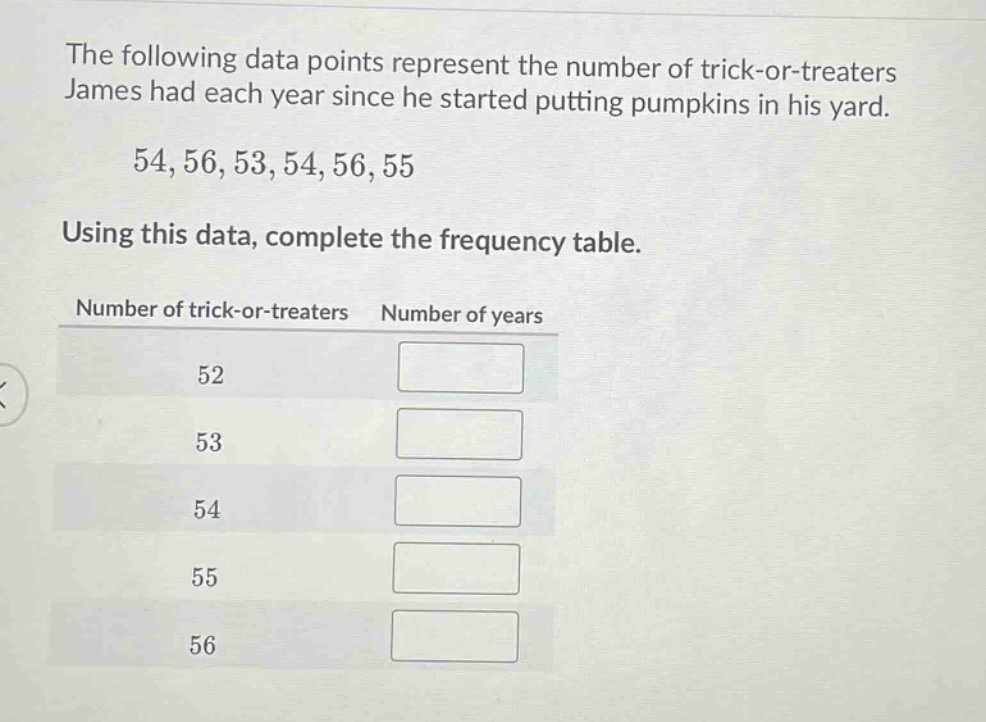
the following data points represent the number of trick - or - treaters james had each year since he started putting pumpkins in his yard. 54,56,53,54,56,55 using this data, complete the frequency table. number of trick - or - treaters number of years 52 53 54 55 56
Answer
Explanation:
Step1: Count occurrences of 52
There is no 52 in the data set 54, 56, 53, 54, 56, 55. So the frequency is 0.
Step2: Count occurrences of 53
The number 53 appears 1 time in the data set. So the frequency is 1.
Step3: Count occurrences of 54
The number 54 appears 2 times in the data set. So the frequency is 2.
Step4: Count occurrences of 55
The number 55 appears 1 time in the data set. So the frequency is 1.
Step5: Count occurrences of 56
The number 56 appears 2 times in the data set. So the frequency is 2.
Answer:
| Number of trick - or - treaters | Number of years |
|---|---|
| 52 | 0 |
| 53 | 1 |
| 54 | 2 |
| 55 | 1 |
| 56 | 2 |