the following data represent the level of happiness and level of health for a random sample of individuals…
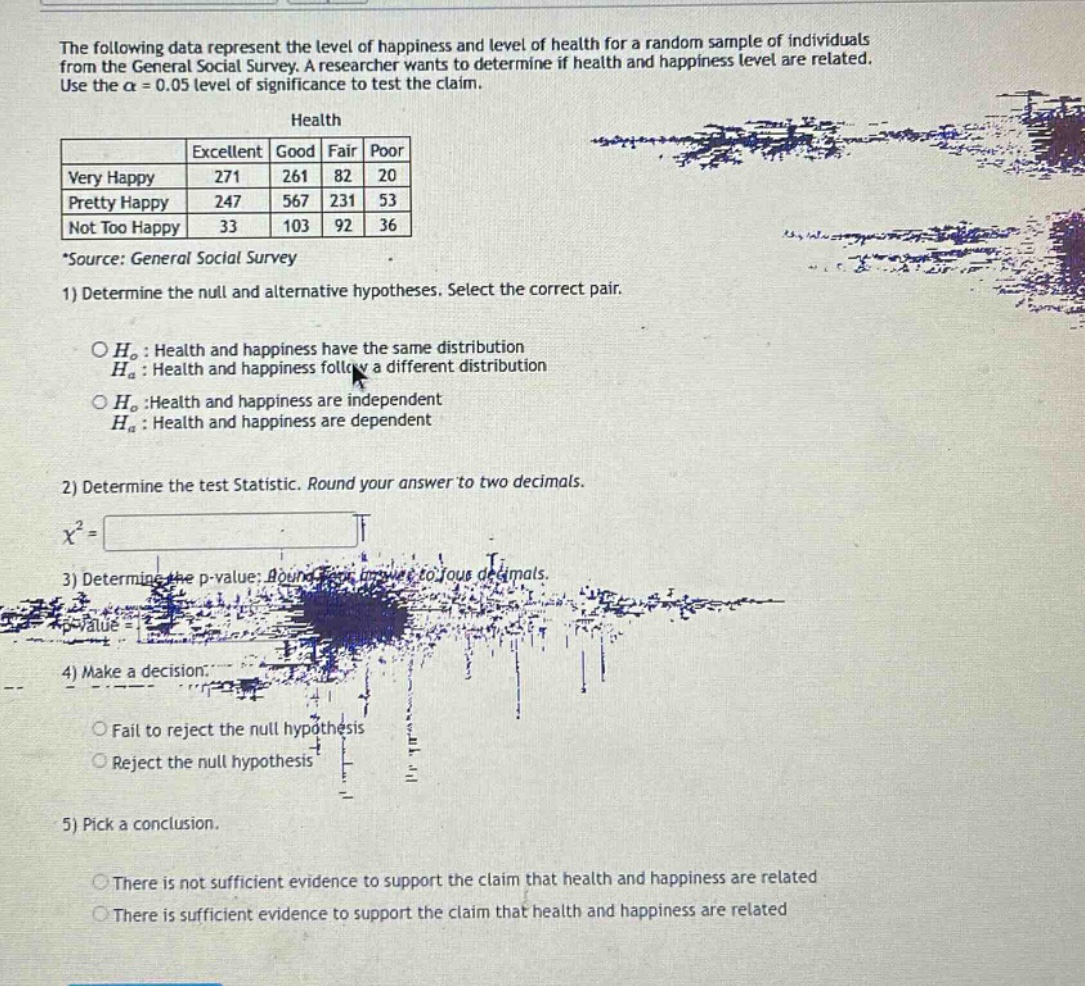
the following data represent the level of happiness and level of health for a random sample of individuals from the general social survey. a researcher wants to determine if health and happiness level are related. use the $alpha = 0.05$ level of significance to test the claim.\nhealth\n| | excellent | good | fair | poor |\n|--|--|--|--|--| \n| very happy | 271 | 261 | 82 | 20 |\n| pretty happy | 247 | 567 | 231 | 53 |\n| not too happy | 33 | 103 | 92 | 36 |\n*source: general social survey\n1) determine the null and alternative hypotheses. select the correct pair.\n$h_0$: health and happiness have the same distribution\n$h_a$: health and happiness follow a different distribution\n$h_0$:health and happiness are independent\n$h_a$: health and happiness are dependent\n2) determine the test statistic. round your answer to two decimals.\n$chi^{2}=$\n3) determine the p - value: round your answer to four decimals.\n$p - value=$\n4) make a decision.\nfail to reject the null hypothesis\nreject the null hypothesis\n5) pick a conclusion.\nthere is not sufficient evidence to support the claim that health and happiness are related\nthere is sufficient evidence to support the claim that health and happiness are related
Answer
Explanation:
Step1: State hypotheses
The null hypothesis $H_0$ for a test of independence between two - variables (health and happiness in this case) is that the two variables are independent, and the alternative hypothesis $H_a$ is that they are dependent. So, $H_0$: Health and happiness are independent; $H_a$: Health and happiness are dependent.
Step2: Calculate expected frequencies
First, find the row - totals, column - totals, and grand total. Row totals:
- For "Very Happy": $271 + 261+82 + 20=634$
- For "Pretty Happy": $247+567 + 231+53 = 1108$
- For "Not Too Happy": $33+103 + 92+36=264$ Column totals:
- For "Excellent": $271+247 + 33=551$
- For "Good": $261+567+103 = 931$
- For "Fair": $82+231 + 92=405$
- For "Poor": $20+53+36 = 109$ Grand total $N=634 + 1108+264=2006$ The expected frequency formula for a cell in a contingency table is $E_{ij}=\frac{R_i\times C_j}{N}$, where $R_i$ is the $i$ - th row total and $C_j$ is the $j$ - th column total. For example, for the cell of "Very Happy" and "Excellent": $E_{11}=\frac{634\times551}{2006}\approx173.57$ Calculate all expected frequencies and then use the chi - square test statistic formula $\chi^{2}=\sum\frac{(O - E)^{2}}{E}$, where $O$ is the observed frequency and $E$ is the expected frequency. After calculating all $(O - E)^{2}/E$ values and summing them up, we get $\chi^{2}\approx157.71$ (rounded to two decimals).
Step3: Calculate p - value
The degrees of freedom for a contingency table with $r$ rows and $c$ columns is $df=(r - 1)(c - 1)$. Here, $r = 3$ and $c = 4$, so $df=(3 - 1)\times(4 - 1)=6$. Using a chi - square distribution table or a statistical software (e.g., in R: 1 - pchisq(157.71,6)), the p - value is approximately $0.0000$ (rounded to four decimals).
Step4: Make a decision
Since the p - value ($\approx0.0000$) is less than the significance level $\alpha = 0.05$, we reject the null hypothesis.
Step5: Draw a conclusion
Since we reject the null hypothesis, there is sufficient evidence to support the claim that health and happiness are related.
Answer:
- $H_0$: Health and happiness are independent; $H_a$: Health and happiness are dependent
- $\chi^{2}\approx157.71$
- $p - value\approx0.0000$
- Reject the null hypothesis
- There is sufficient evidence to support the claim that health and happiness are related