the following dot plot shows the number of books each student checked out from the library last month. each…
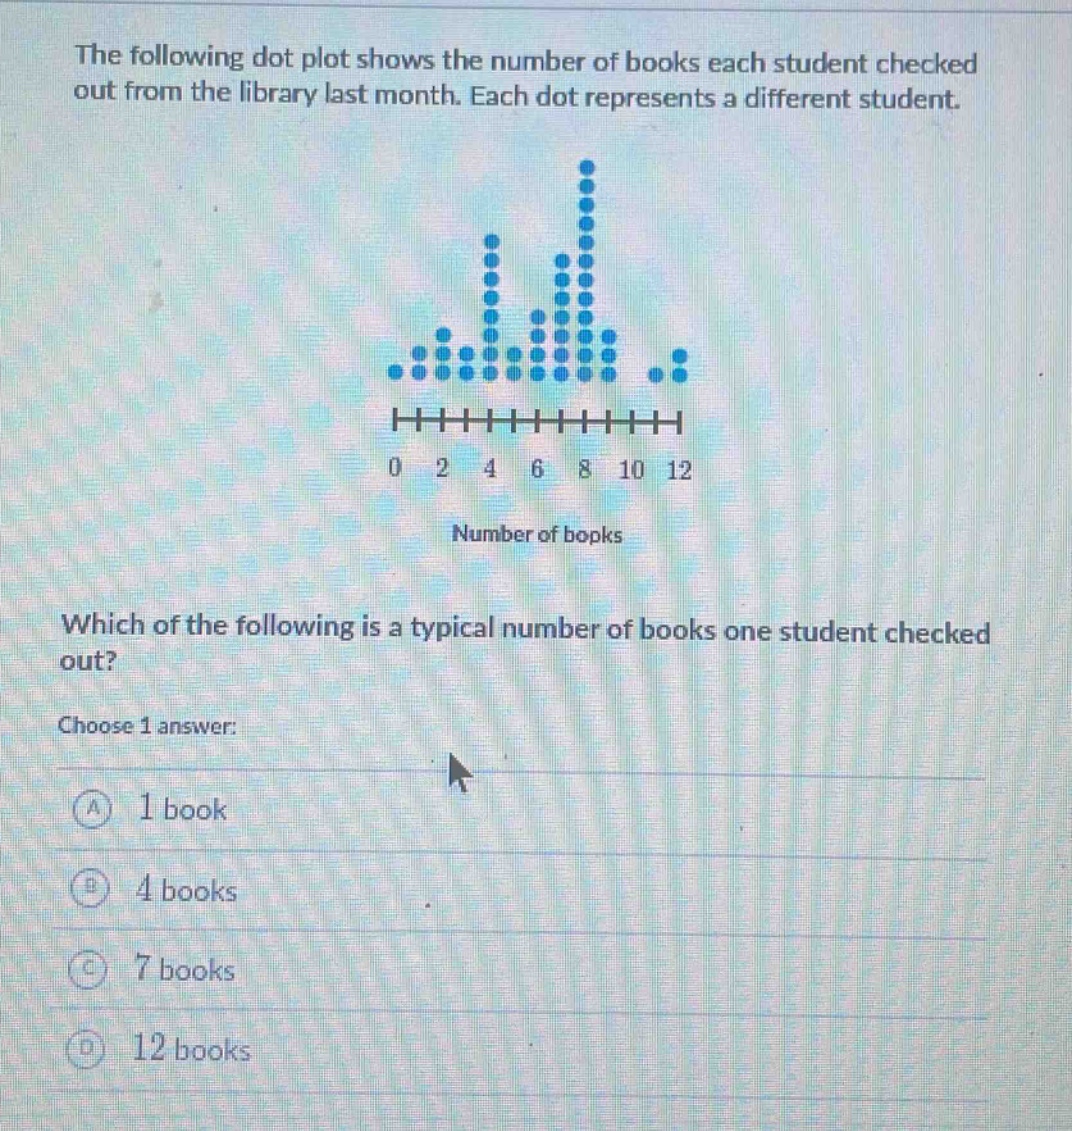
the following dot plot shows the number of books each student checked out from the library last month. each dot represents a different student. which of the following is a typical number of books one student checked out? choose 1 answer: a 1 book b 4 books c 7 books d 12 books
Answer
Explanation:
Step1: Identify the mode concept
The mode represents a typical value in a data - set. In a dot - plot, it is the value with the most dots.
Step2: Count dots for each value
For 1 book, there are few dots. For 4 books, there are more dots. For 7 books, there are the most dots. For 12 books, there are few dots.
Answer:
C. 7 books