the following graphs have a line of best fit drawn incorrectly. use the given line to fix the mistake and…
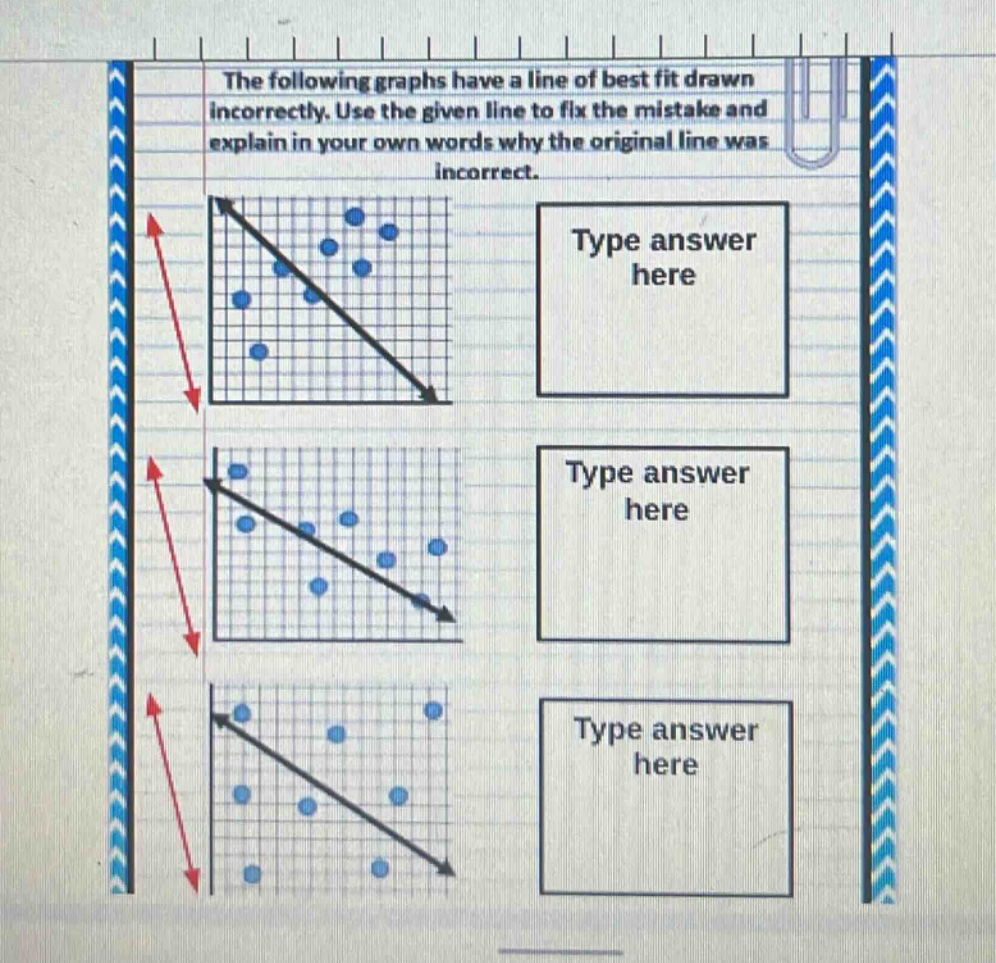
the following graphs have a line of best fit drawn incorrectly. use the given line to fix the mistake and explain in your own words why the original line was incorrect.
Answer
Explanation:
Step1: Understand line - of - best - fit concept
A line of best fit should minimize the distance between the points and the line. It should pass through the "center" of the data points.
Step2: Analyze first graph
The original line in the first graph is too high on the left - hand side. It does not represent the overall trend of the data well. To fix it, the line should be adjusted downwards on the left side so that it is closer to more of the data points. The original line was incorrect because it did not account for the overall clustering of points and deviated too much from the majority of the data on the left.
Step3: Analyze second graph
The original line in the second graph is too steep. It does not capture the more gradual decrease in the data points. To fix it, the slope of the line should be decreased so that it passes closer to more of the points. The original line was incorrect as it over - estimated the rate of decrease of the data.
Step4: Analyze third graph
The original line in the third graph is too low on the right - hand side. It does not follow the upward trend of the data points on the right. To fix it, the line should be adjusted upwards on the right side to be closer to the points. The original line was incorrect because it did not account for the upward trend of the data on the right.
Answer:
For the first graph: Adjust the line down on the left. Reason: Original line deviated from left - side data. For the second graph: Decrease the slope of the line. Reason: Original line over - estimated the rate of decrease. For the third graph: Adjust the line up on the right. Reason: Original line did not follow right - side upward trend.