2. which of the following graphs below shows a strong positive correlation? a. graph 1 b. graph 2 c. graph 3
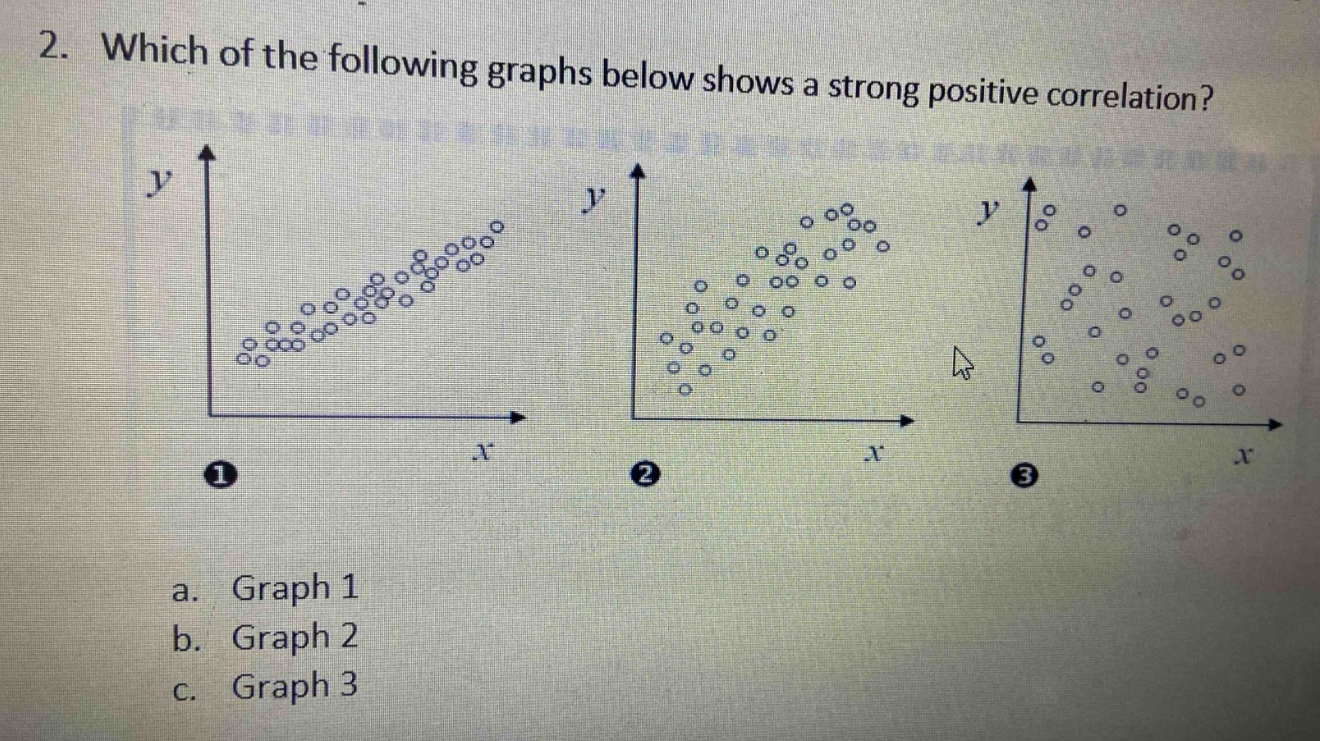
2. which of the following graphs below shows a strong positive correlation? a. graph 1 b. graph 2 c. graph 3
Answer
Explanation:
Step1: Recall positive - correlation concept
In a positive - correlation, as the value of $x$ increases, the value of $y$ also increases.
Step2: Recall strong - correlation concept
In a strong correlation, the data points are closely clustered around a line.
Step3: Analyze each graph
Graph 1: The data points are closely clustered and as $x$ increases, $y$ increases. Graph 2: The data points are more spread out and the upward trend is less clear. Graph 3: There is no clear upward or downward trend.
Answer:
a. Graph 1