which of the following could indicate that a data set is normally distributed? select all that apply.\na. a…
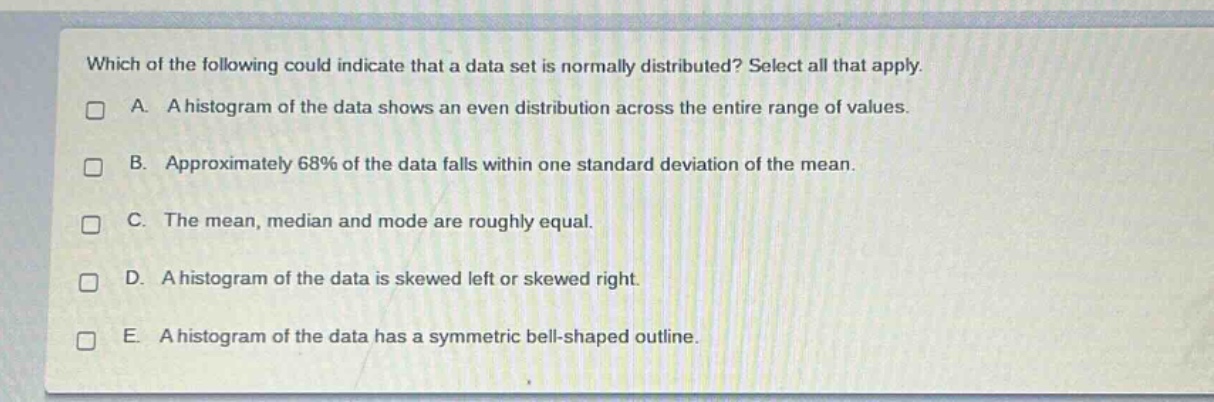
which of the following could indicate that a data set is normally distributed? select all that apply.\na. a histogram of the data shows an even distribution across the entire range of values.\nb. approximately 68% of the data falls within one standard deviation of the mean.\nc. the mean, median and mode are roughly equal.\nd. a histogram of the data is skewed left or skewed right.\ne. a histogram of the data has a symmetric bell - shaped outline.
Answer
Answer:
B. Approximately 68% of the data falls within one standard deviation of the mean. C. The mean, median and mode are roughly equal. E. A histogram of the data has a symmetric bell - shaped outline.
Explanation:
Step1: Recall normal distribution properties
In a normal distribution, about 68% of data is within 1 standard deviation of the mean.
Step2: Consider central tendency
The mean, median and mode are equal or very close in a normal distribution.
Step3: Analyze histogram shape
A normal distribution has a symmetric bell - shaped histogram.
Step4: Analyze incorrect options
An even distribution (A) is not characteristic of normal distribution. A skewed histogram (D) indicates non - normality.