which of the following scatterplots would have a trend line with a positive slope?
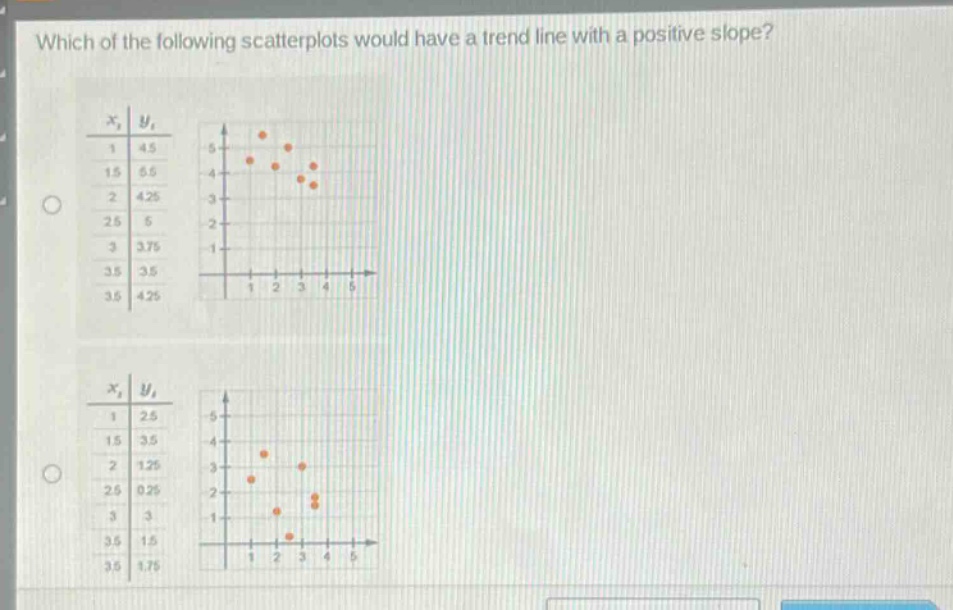
which of the following scatterplots would have a trend line with a positive slope?
Answer
Explanation:
Step1: Recall slope concept
A positive - slope trend line means that as the (x) - values increase, the (y) - values generally increase.
Step2: Analyze first scatter - plot
In the first scatter - plot, as (x) increases from (1) to (3.5), (y) values do not show a consistent upward trend. For example, when (x) goes from (1) to (1.5), (y) increases from (4.5) to (5.5), but when (x) goes from (2) to (2.5), (y) decreases from (4.25) to (3.75).
Step3: Analyze second scatter - plot
In the second scatter - plot, as (x) increases from (1) to (3.5), the (y) values generally decrease. For example, when (x = 1), (y = 2.5) and when (x=3.5), (y = 1.5) for some of the points.
Since no scatter - plot in the provided images shows a consistent increase in (y) as (x) increases, there is no correct answer among the given options. But if we assume there are more options or a correct one exists in a proper set, we look for a scatter - plot where as (x) values move to the right (increase), (y) values move up (increase).