the following set of data is the average low temperatures for two weeks. week one: 74, 73, 74, 73, 76, 76…
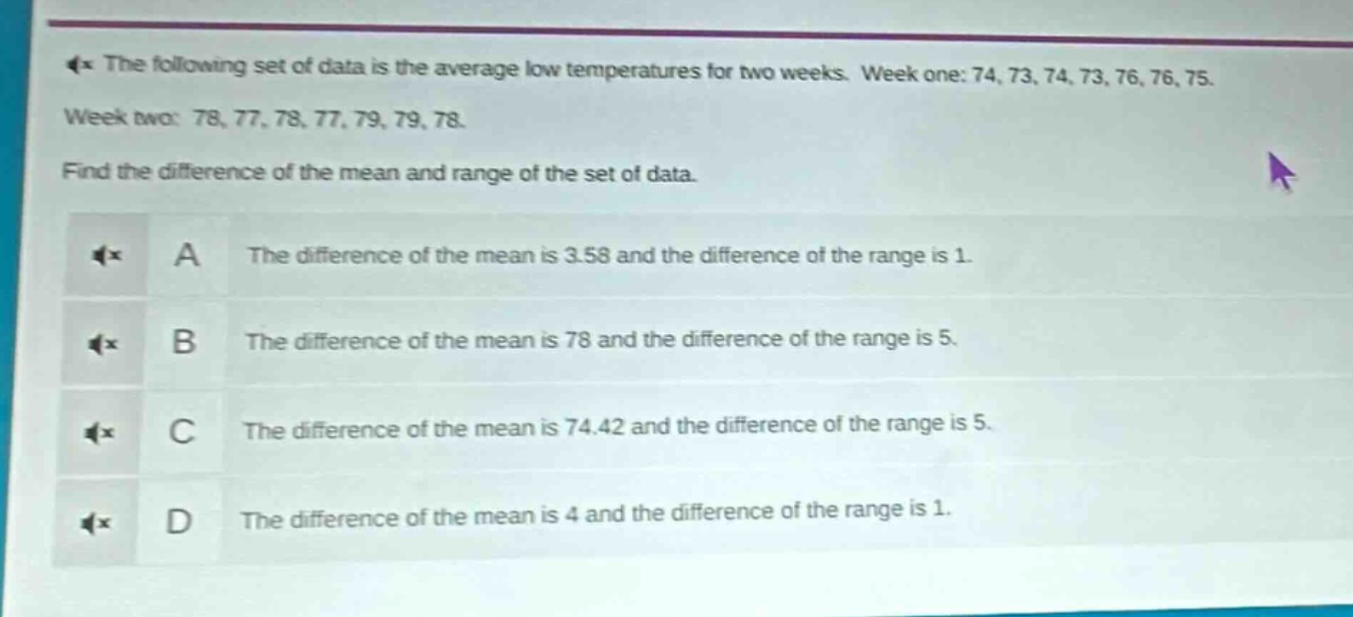
the following set of data is the average low temperatures for two weeks. week one: 74, 73, 74, 73, 76, 76, 75. week two: 78, 77, 78, 77, 79, 79, 78. find the difference of the mean and range of the set of data.\na the difference of the mean is 3.58 and the difference of the range is 1.\nb the difference of the mean is 78 and the difference of the range is 5.\nc the difference of the mean is 74.42 and the difference of the range is 5.\nd the difference of the mean is 4 and the difference of the range is 1.
Answer
Explanation:
Step1: Calcular la media de la semana 1
La suma de los datos de la semana 1 es (74 + 73+74 + 73+76+76+75=521). Hay (n_1 = 7) datos. La media (\bar{x}_1=\frac{521}{7}\approx74.42).
Step2: Calcular la media de la semana 2
La suma de los datos de la semana 2 es (78 + 77+78+77+79+79+78 = 546). Hay (n_2=7) datos. La media (\bar{x}_2=\frac{546}{7}=78).
Step3: Calcular la diferencia de las medias
(\bar{x}_2-\bar{x}_1=78 - 74.42=3.58).
Step4: Calcular el rango de la semana 1
El valor máximo en la semana 1 es (76) y el valor mínimo es (73). El rango (R_1=76 - 73 = 3).
Step5: Calcular el rango de la semana 2
El valor máximo en la semana 2 es (79) y el valor mínimo es (77). El rango (R_2=79 - 77 = 2).
Step6: Calcular la diferencia de los rangos
(R_1 - R_2=3 - 2=1).
Answer:
A. The difference of the mean is 3.58 and the difference of the range is 1.