which of the following statements are true? check all of the boxes that apply. the female dog graph is…
which of the following statements are true? check all of the boxes that apply. the female dog graph is skewed. the range for female dogs is much larger than the range for male dogs. the female dog data is best represented by the median. the female dog data is less skewed than the male dog data. done
Answer
Explanation:
Step1: Analyze skewness
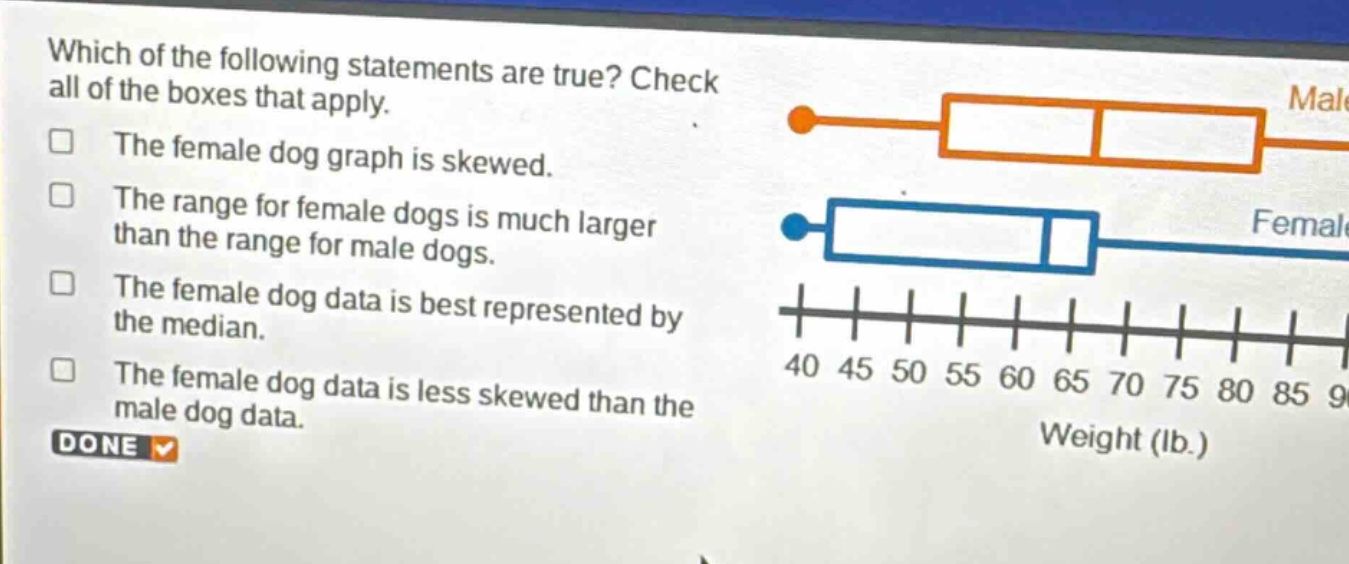
By observing the box - and - whisker plots, the female dog graph has a longer tail on the right side, so it is skewed.
Step2: Analyze range
The range is the difference between the maximum and minimum values. For male dogs, the range is larger as the whiskers are more spread out compared to female dogs.
Step3: Analyze data representation
Since the female dog data is skewed, the median is a better measure of central tendency than the mean.
Step4: Analyze relative skewness
The male dog data has a more symmetric box - and - whisker plot compared to the female dog data which is more skewed.
Answer:
The female dog graph is skewed. The female dog data is best represented by the median.