which of the following statements is true about a graph that is skewed, such as the one above?\nthe mean is…
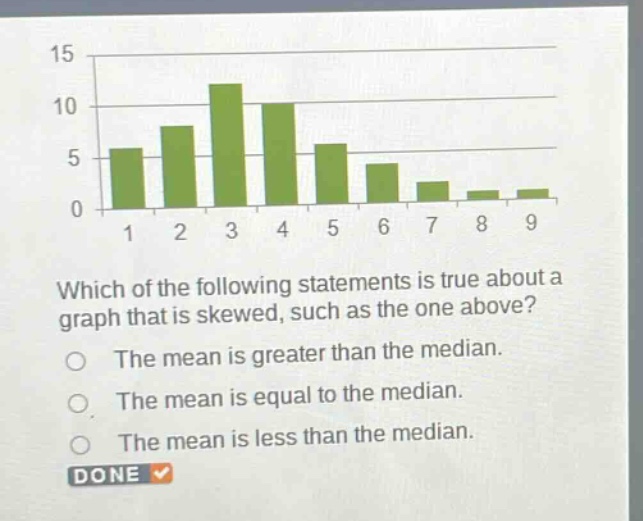
which of the following statements is true about a graph that is skewed, such as the one above?\nthe mean is greater than the median.\nthe mean is equal to the median.\nthe mean is less than the median.\ndone
Answer
Brief Explanations:
The provided histogram shows a distribution where the bulk of the data is concentrated on the left side, and the tail extends towards the right. This shape indicates a right-skewed (or positively skewed) distribution. In a right-skewed distribution, the mean is pulled towards the higher values in the tail, making it greater than the median, which represents the middle value of the dataset. The median is less affected by extreme values than the mean.
Answer:
The mean is greater than the median.