the following table displays the number of sofas sold in a furniture store during certain months of the…
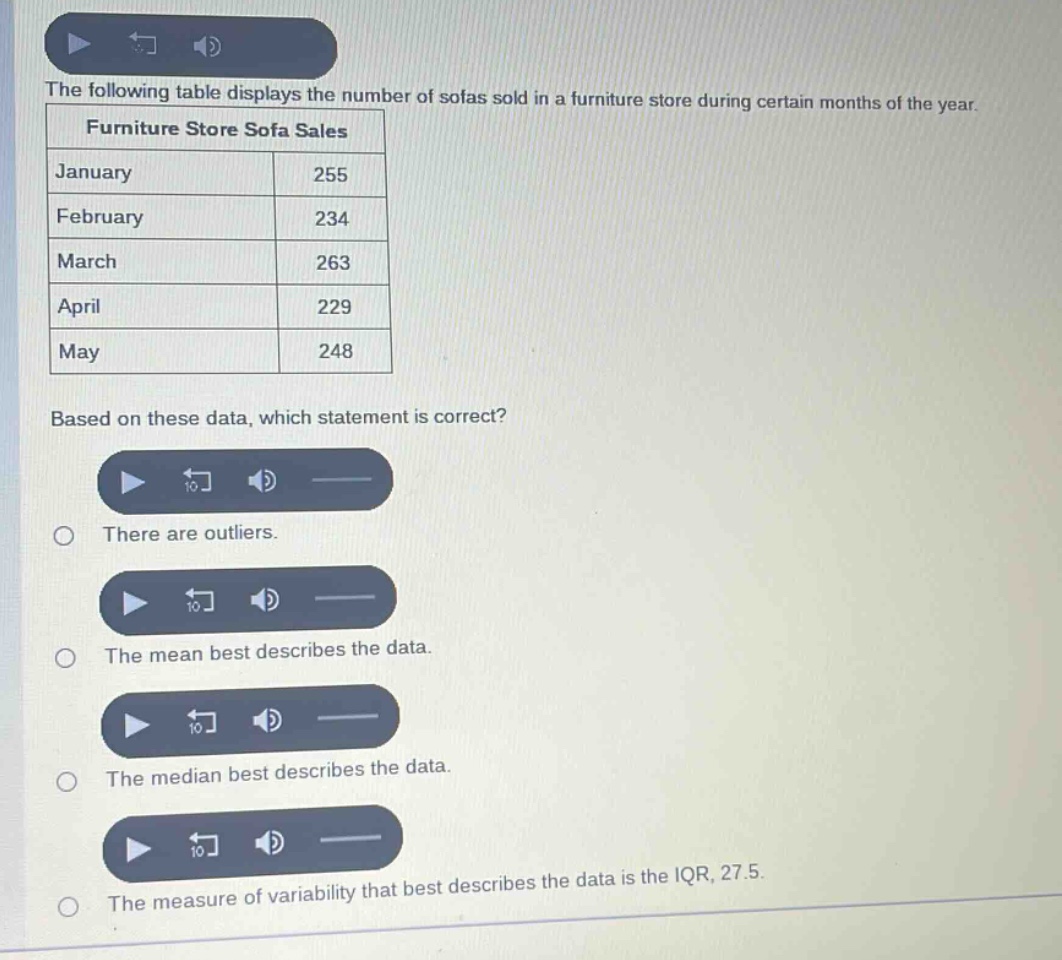
the following table displays the number of sofas sold in a furniture store during certain months of the year.\nfurniture store sofa sales\njanuary 255\nfebruary 234\nmarch 263\napril 229\nmay 248\nbased on these data, which statement is correct?\nthere are outliers.\nthe mean best describes the data.\nthe median best describes the data.\nthe measure of variability that best describes the data is the iqr, 27.5.
Answer
Explanation:
Step1: Arrange data in ascending order
$229, 234, 248, 255, 263$
Step2: Find the median
Since $n = 5$ (odd), median is the middle - value. Median $= 248$.
Step3: Find the lower half and upper half
Lower half: $229, 234$; Upper half: $255, 263$
Step4: Find the first quartile ($Q_1$) and third quartile ($Q_3$)
$Q_1=\frac{229 + 234}{2}=231.5$, $Q_3=\frac{255+263}{2}=259$
Step5: Calculate the inter - quartile range (IQR)
$IQR=Q_3 - Q_1=259 - 231.5 = 27.5$
Step6: Check for outliers
Lower fence: $Q_1-1.5\times IQR=231.5-1.5\times27.5=231.5 - 41.25 = 190.25$ Upper fence: $Q_3 + 1.5\times IQR=259+1.5\times27.5=259 + 41.25 = 300.25$ Since all data values ($229, 234, 248, 255, 263$) are within the fences, there are no outliers. The data has no extreme values that would skew the mean, so the mean can be a good measure. But also, the median is a robust measure. However, when we consider the measure of variability, the IQR is a good measure for non - symmetric data or data with potential outliers (even though there are no outliers here).
Answer:
The measure of variability that best describes the data is the IQR, 27.5.