a football coach compared the yards per game of two of his running backs over the course of 10 games. based…
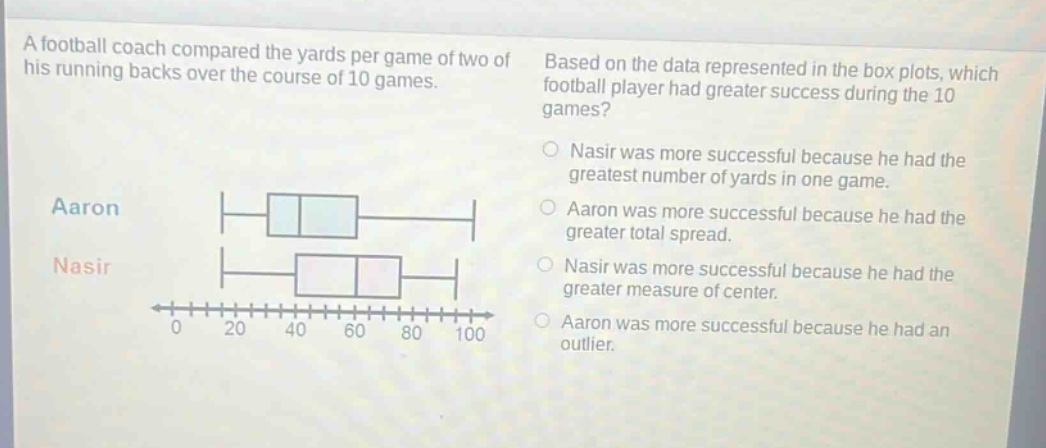
a football coach compared the yards per game of two of his running backs over the course of 10 games. based on the data represented in the box plots, which football player had greater success during the 10 games? aaron nasir 0 20 40 60 80 100 nasir was more successful because he had the greatest number of yards in one game. aaron was more successful because he had the greater total spread. nasir was more successful because he had the greater measure of center. aaron was more successful because he had an outlier.
Answer
Explanation:
Step1: Understand box - plot measures
The measure of center in a box - plot is the median. A greater median indicates that, on average, the player had more yards per game.
Step2: Analyze the box - plots
By looking at the box - plots, Nasir's box - plot has a greater median (the line inside the box) compared to Aaron's. This means Nasir had a greater measure of center.
Answer:
Nasir was more successful because he had the greater measure of center.